. 2023 Sep 19;11(22):7346–7357. doi: 10.1039/d3bm00873h

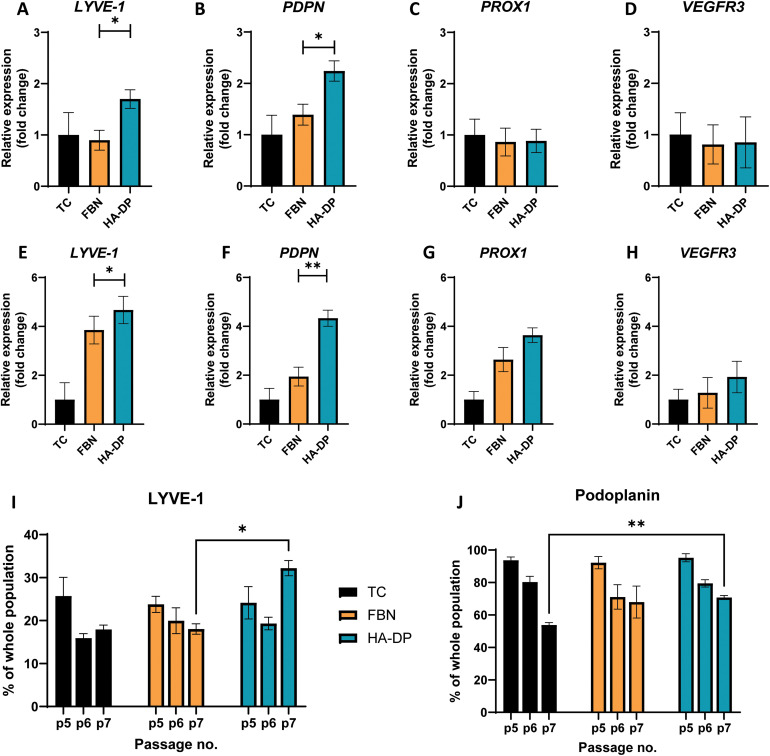
Fig. 4. Protein and gene expression of LEC cultured on different coatings. Real-time qRT-PCR for early passage (P.5) LECs cultured on tissue culture plate (black), fibronectin-coated plate (yellow), and HA–DP (blue) coated plate for (A) LYVE-1, (B) PDPN, (C) Prox1, and (D) VEGFR3. Real-time qRT-PCR for late passage (P.7) LECs cultured on tissue culture plate (black), fibronectin-coated plate (yellow), and HA–DP (blue) coated plate for (E) LYVE-1, (F) PDPN, (G) Prox1, and (H) VEGFR3. Three biological replicates (n = 3) were collected per condition and analysed with real-time qRT-PCR with triplicate readings. Flow cytometry analysis for LECs (P.5–7) cultured on tissue culture plate (black), fibronectin-coated plate (yellow), and HA–DP (blue) coated plate indicating percentage of cells that are (I) LYVE-1+ and (J) podoplanin+. Data represents mean ± stdev., n = 4 per condition. Significance levels were set at: *P < 0.5 and **P < 0.01.

Fig. 4