. 2023 Sep 19;11(22):7346–7357. doi: 10.1039/d3bm00873h

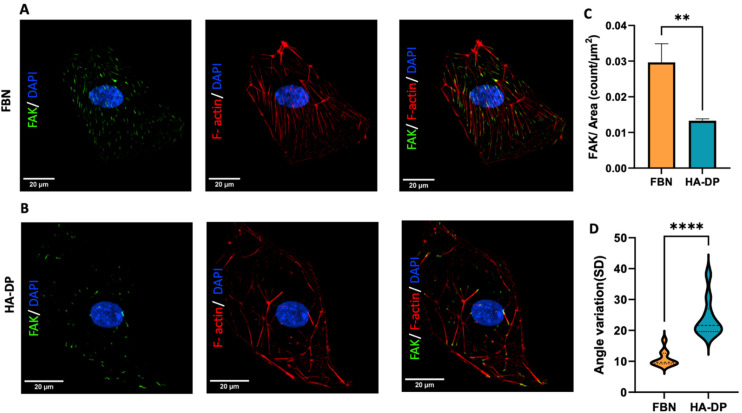
Fig. 5. Focal adhesion kinase (FAK) expression of LECs cultured on fibronectin and HA–DP coated plates. Representative immunofluorescent images of LECs (P.7) cultured on (A) fibronectin and (B) HA–DP coated plates stained for FAK (green), F-actin (red), and nuclei (blue). Scale bars are 20 μm. (C) The number of FAK per surface area was analysed for LECs cultured on fibronectin and HA–DP coated plates. (D) The orientation of F-actin was analysed using angle variation (SD) for LECs cultured on fibronectin and HA–DP coated plates. Data represents mean ± stdev., n = 4 per condition. Significance levels were set at: **P < 0.05 and ****P < 0.001.

Fig. 5