. 2023 Sep 19;11(22):7346–7357. doi: 10.1039/d3bm00873h

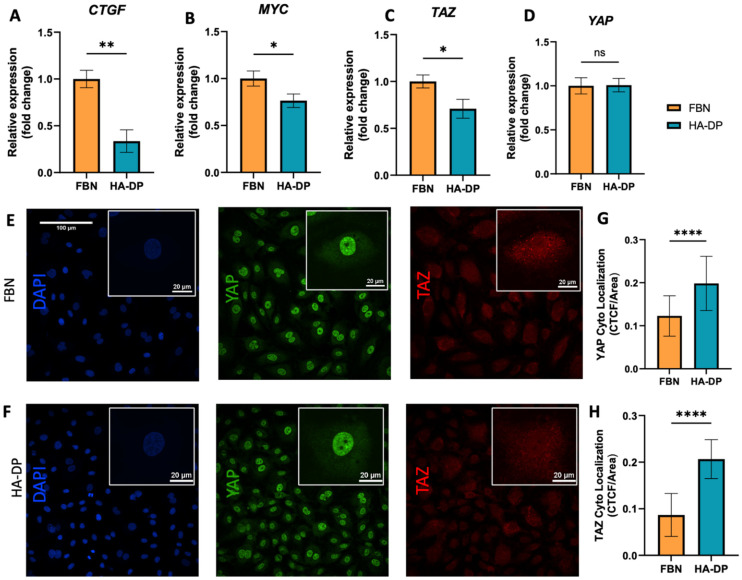
Fig. 6. YAP/TAZ expression for LECs cultured on HA–DP and fibronectin coated plates. Real-time qRT-PCR data for (A) CTGF, (B) MYC, (C) YAP, and (D) TAZ expressed by LECs (P.7) cultured on HA–DP and fibronectin coated plates. Three biological replicates (n = 3) were collected per condition and analysed with real-time qRT-PCR with triplicate readings. Representative confocal z-stacks of LECs (P.7) cultured on (E) fibronectin and (F) HA–DP coated plates stained with YAP (green), TAZ (red) and nuclei (blue). Scale bars are 100 μm. Insets indicate the localization of YAP (green) and TAZ (red). Scale bars are 20 μm. Fluorescent intensity quantification demonstrates (G) an increase in cytoplasmic localization for YAP and (H) an increase in cytoplasmic localization of TAZ for LECs cultured on HA–DP compared to fibronectin. CTCF, corrected total cell fluorescence. Data represents mean ± stdev., n = 4 per condition. Significance levels were set at: **P < 0.5, **P < 0.05 and ****P < 0.001.

Fig. 6