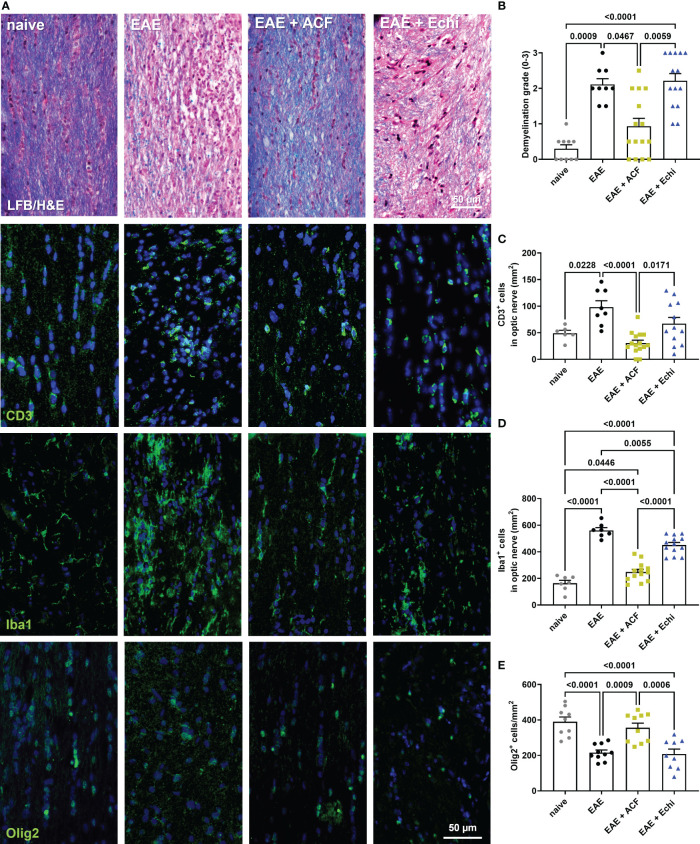
Figure 4.
Optic nerve immunohistopathology 42 days after EAE induction. (A) Representative images of longitudinal optic nerve sections from naïve controls and EAE mice stained with LFB/H&E and for assessment of CD3+ cells, Iba1+ microglia/macrophages, and Olig2+ oligodendrocytes. (B) Status of demyelination grading revealed protection of myelination in EAE+ACF mice, which was accompanied by reduced CD3 cell infiltration (C), decreased microglia activation (D), and increased numbers of Olig2+ cells (E) when compared to untreated EAE mice and the EAE+Echi cohort. Statistics for graph in C were calculated by non-parametric test using the Kruskal–Wallis test; all other data were determined by ANOVA and Tukey post hoc test.

