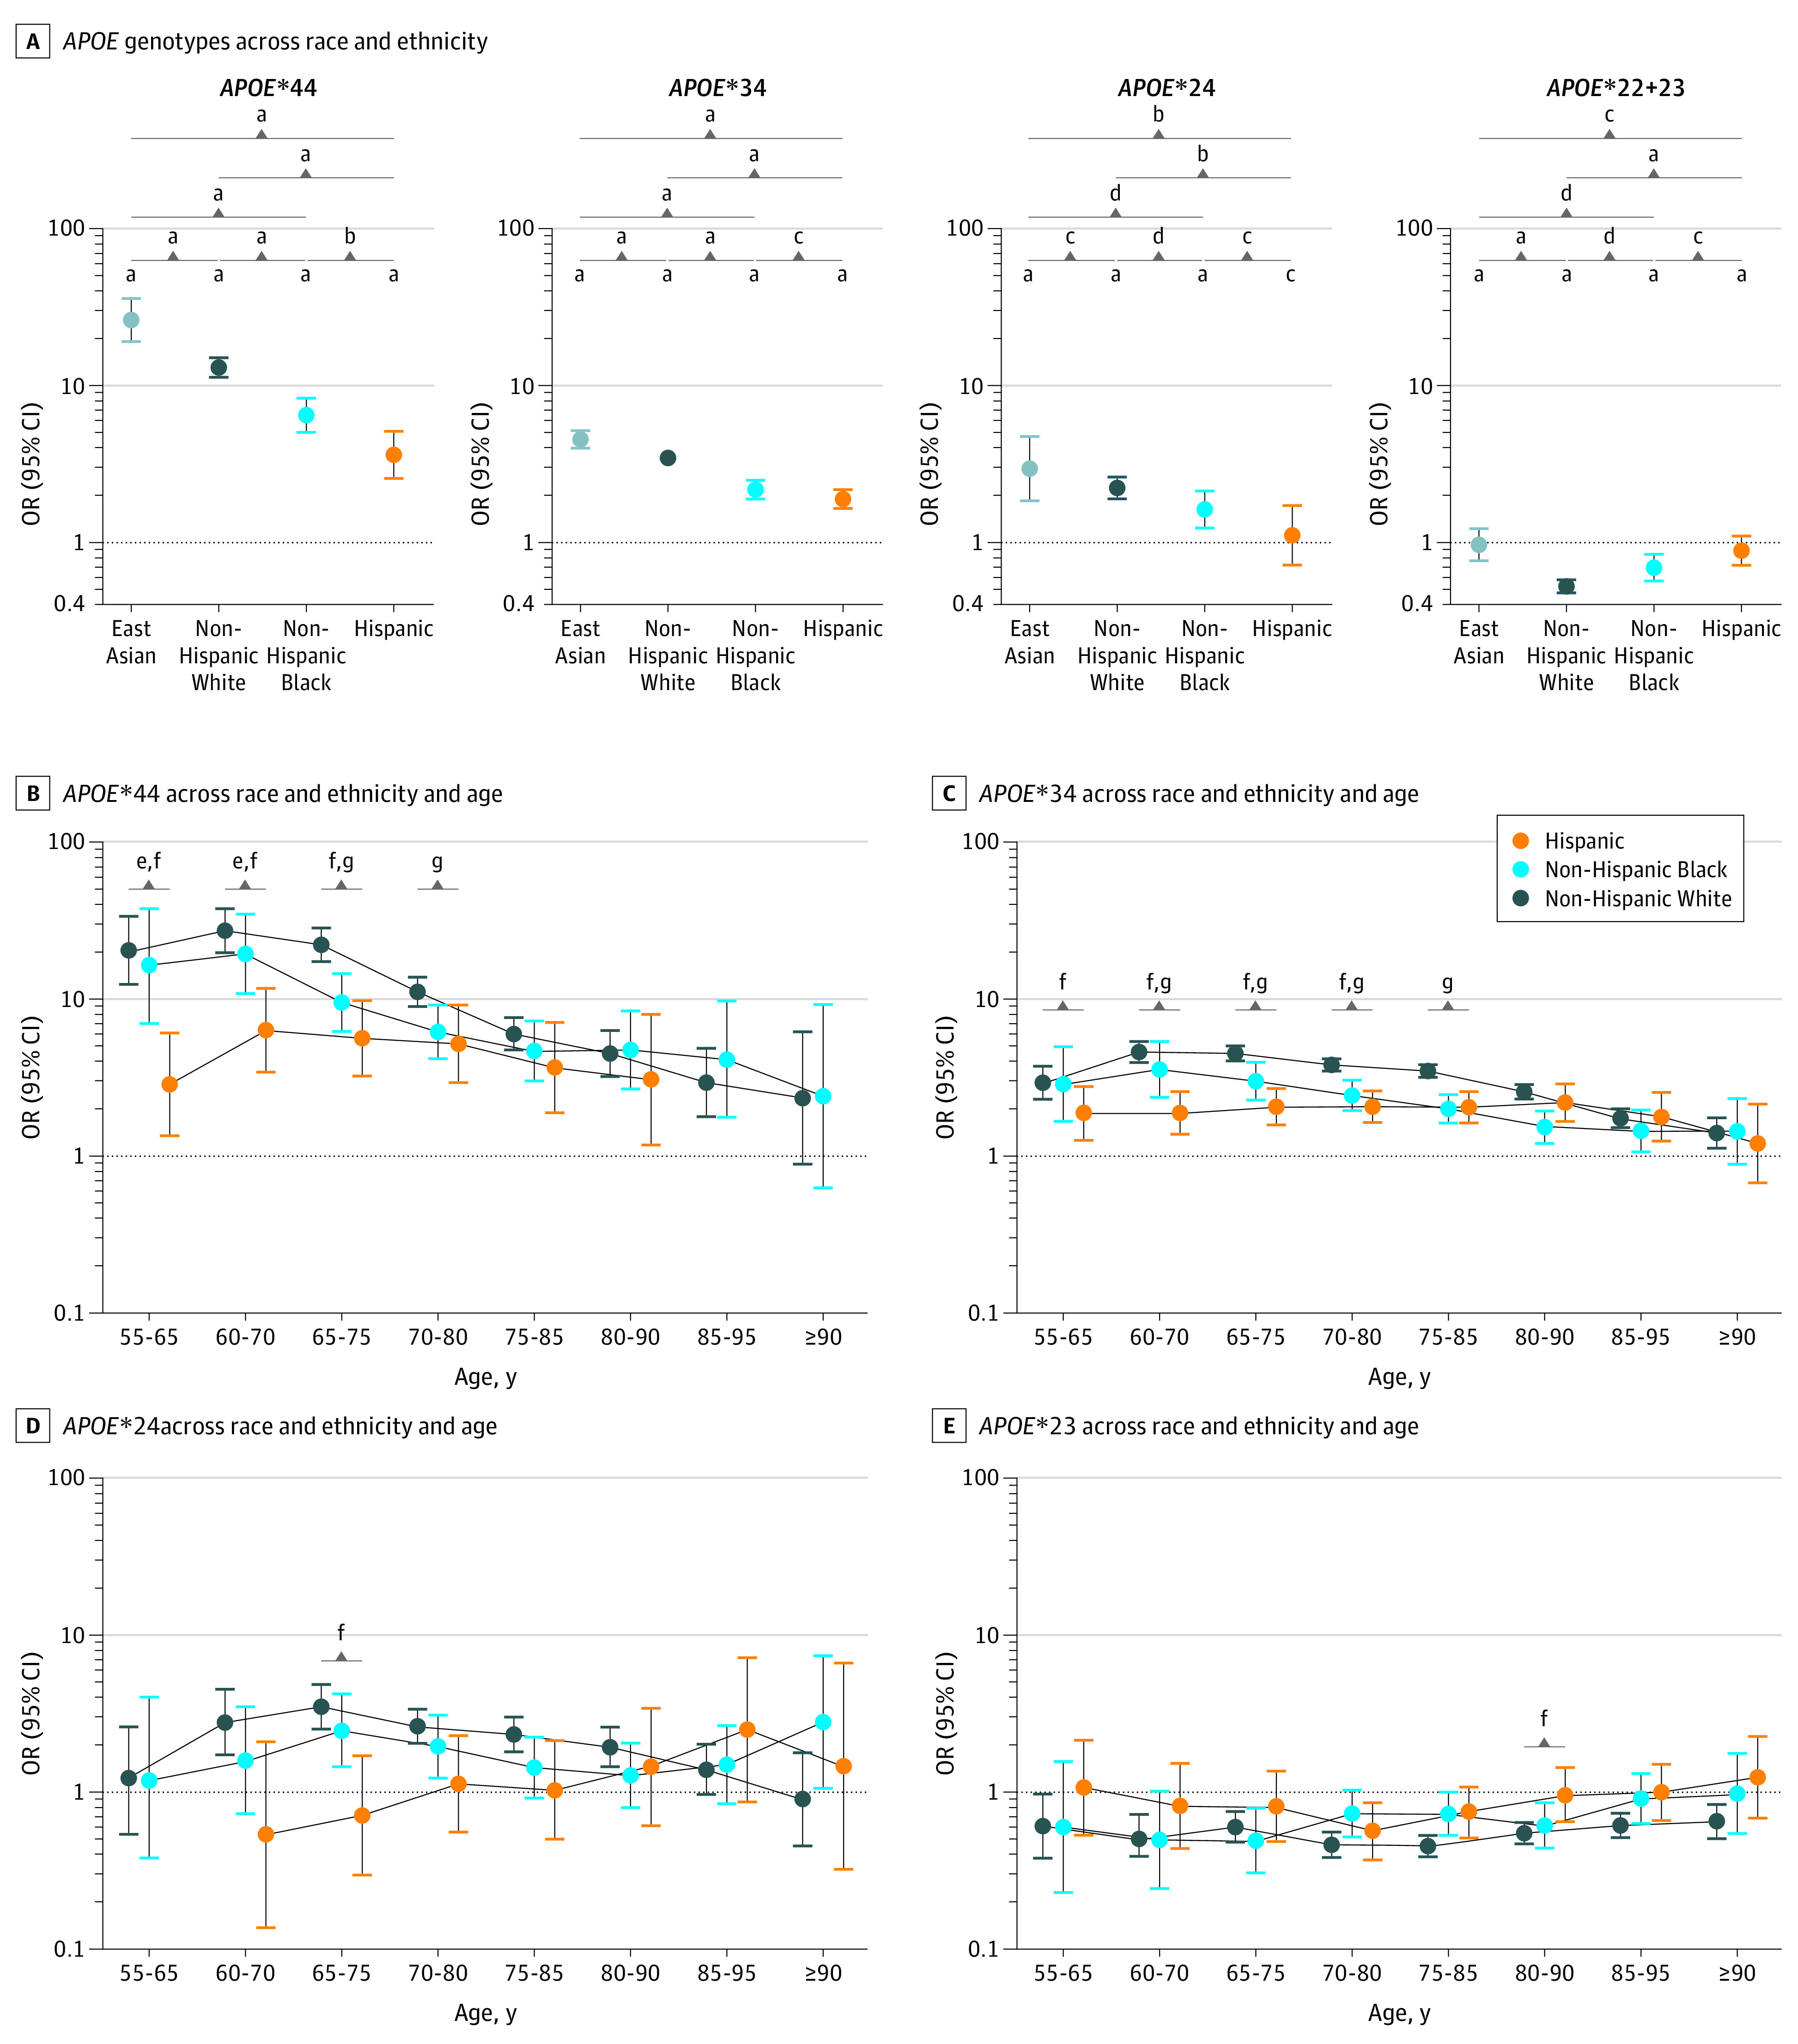
Figure 1. Associations of Apolipoprotein E (APOE) Genotypes With Alzheimer Disease Risk Across Race and Ethnicity and Age.

A, Related summary statistics are given in eTable 6 in Supplement 1.
aP < .001.
bP < .01.
cP ≥ .05.
dP < .05.
eP < .05 for Hispanic individuals vs non-Hispanic Black individuals after Bonferroni correction of the amount of overlapping age windows.
fP < .05 for Hispanic individuals vs non-Hispanic White individuals after Bonferroni correction of the amount of overlapping age windows.
gP < .05 for non-Hispanic Black individuals vs non-Hispanic White individuals after Bonferroni correction of the amount of overlapping age windows.
