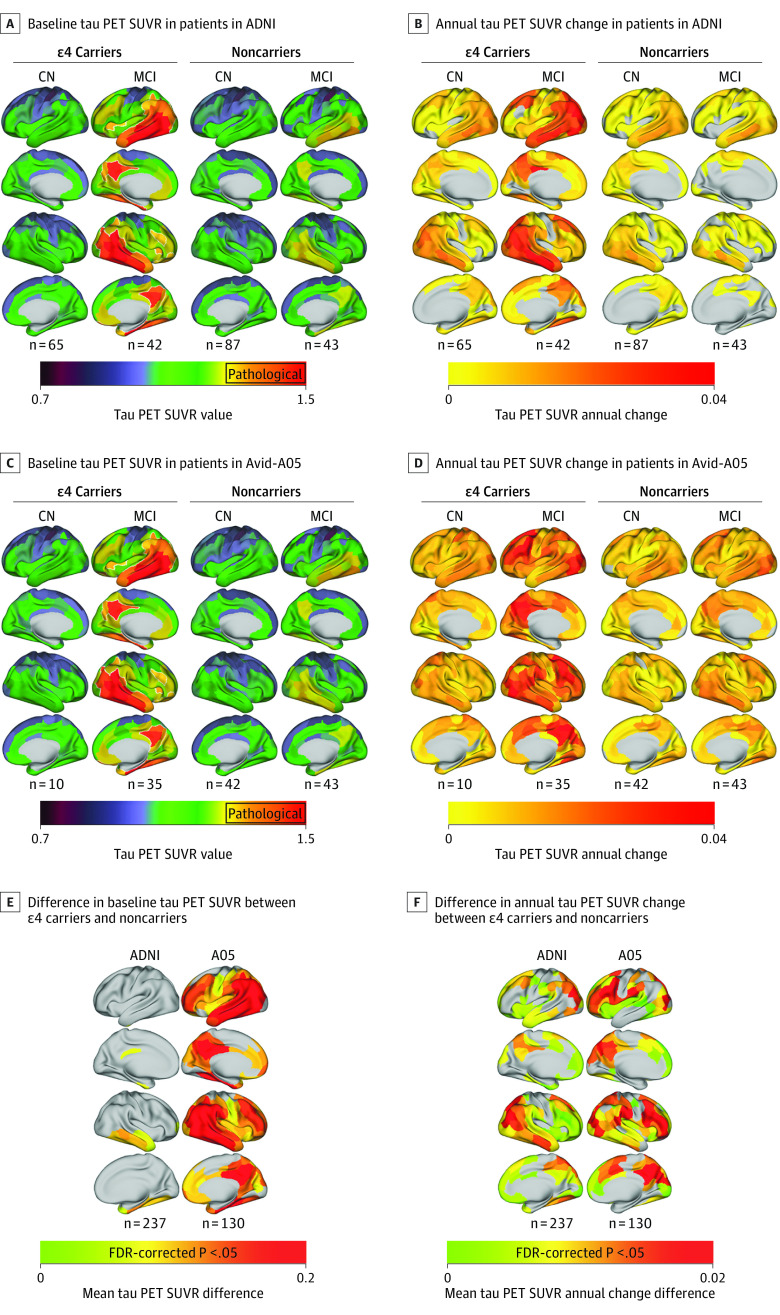
Figure 1. Group Average Tau Positron Emission Tomography (PET) Standardized Uptake Value Ratios (SUVRs) at Baseline Stratified by Apolipoprotein E ε4 (ApoE4) Status and Diagnostic Group.
Tau PET SUVRs are shown as continuous values, white outlines define areas that surpass a preestablished pathological tau SUVR threshold of 1.344 in participants in the Alzheimer’s Disease Neuroimaging Initiative (ADNI) (A) and in the Avid-A05 study (C). Number of patients displayed under each group rendering; group average tau SUVR annual change rates defined by linear mixed models, stratified by ApoE4 carriership and diagnostic group in patients in ADNI (B) and those in the Avid-A05 study (D). Tukey honestly significant difference (95% CI) post hoc tests on region of interest–wise analysis of covariance reveal mean differences between tau PET SUVR values of ApoE4 carriers minus those of noncarriers (E) and their annual tau PET SUVR change (F) stratified by sample. FDR indicates false discovery rate.

