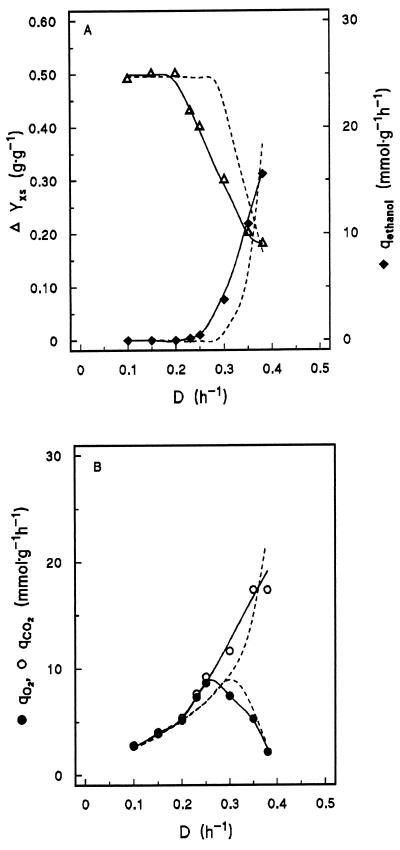
FIG. 3.
Effect of D on biomass yield (Yxs; grams of dry yeast biomass · gram of glucose−1) and the specific rate of ethanol production (qethanol) (A) and on the specific rates of oxygen consumption (qO2) and carbon dioxide production (qCO2) (B) in aerobic glucose-limited chemostat cultures of the Pdc-overproducing strain S. cerevisiae GG393. Fluxes are expressed in millimoles · gram of dry yeast biomass−1 · h−1. The broken lines represent data for the wild-type and control strains as depicted in Fig. 2.

