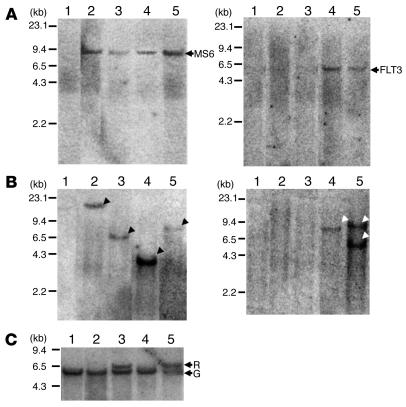
Figure 7.
Southern blot analysis of spleen DNA obtained from representative mice transplanted with mock/GFP, MS6/GFP, and MS6/FLT3. Genomic DNA extracted from each spleen was digested with NheI (A), BamHI (B), or EcoRI (C) and hybridized with the Neo probe (A and B, left), the GFP probe (A and B, right), or the JH probe (C). (A) Each single band of intact proviral DNA, including MLL-SEPT6 (MS6) and FLT3-ITD (FLT3), is indicated by an arrow with each abbreviation. (B) Oligoclonal bands of proviral integration sites of MS6 or FLT3 are indicated by black or white arrowheads, respectively. (C) Germ line (G) or rearrangements (R) of IgH gene are indicated by an arrow with each abbreviation. Lane 1, mock/GFP mouse; lanes 2 and 3, MS6/GFP mice; lanes 4 and 5, MS6/FLT3 mice.

