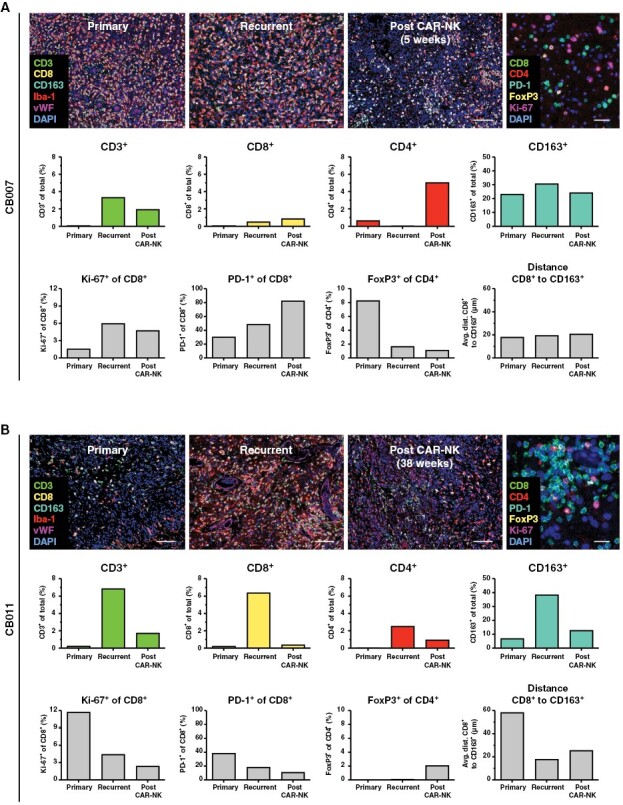
Figure 4.

Spatial analysis of immune cell subpopulations in the course of disease progression. Multiplex immunofluorescence images of regions of interests selected within whole slide scans derived from primary, recurrent and post chimeric antigen receptor (CAR)-NK therapy tumor tissues of patients CB007 (A) and CB011 (B) are displayed. Two different staining panels to detect CD3, CD8, CD163, Iba-1, vWF, DAPI (mixed panel; scale bars: 100 µm), and CD8, CD4, PD-1, FoxP3, Ki-67, DAPI (lymphoid panel; scale bars: 50 µm) were employed. Staining with the lymphoid panel is shown for recurrent tumor tissue as an example.
