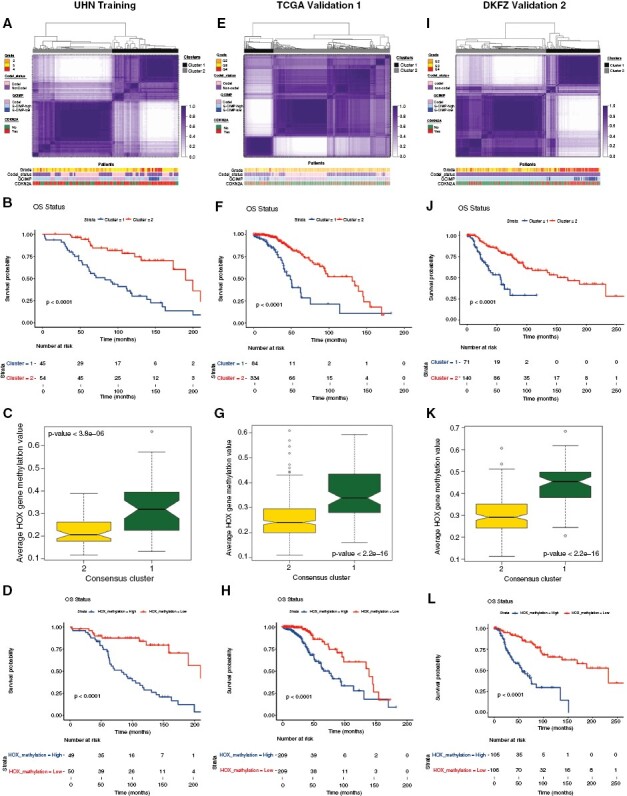
Figure 1.

Methylome analysis of IDH-mutant gliomas identifies a distinct signature of outcome.27 (A) Consensus cluster based on the methylation signatures from Cox regression analysis of the University Health Network methylation cohort. (B) Kaplan–Meier diagram showing the survival statistics of methylation subtypes. (C) Boxplots of mean methylation values of HOX genes chosen from Cox analysis for 2 consensus cluster subtypes. The boxplot of average methylation values was calculated from the probes that overlapped with HOX genes for each sample in each consensus cluster subtype. (D) HOX gene-specific methylation patterns from the Cox analysis with significant probes show survival differences (Kaplan–Meier diagram) by median of average methylation values. (E):l Validation of global methylation signature related to patient outcome (A, B) and HOX gene-specific methylation patterns (C, D) using Kaplan–Meier survival analysis in 2 independent The Cancer Genome Atlas and DKFZ cohorts.
