Figure 2.

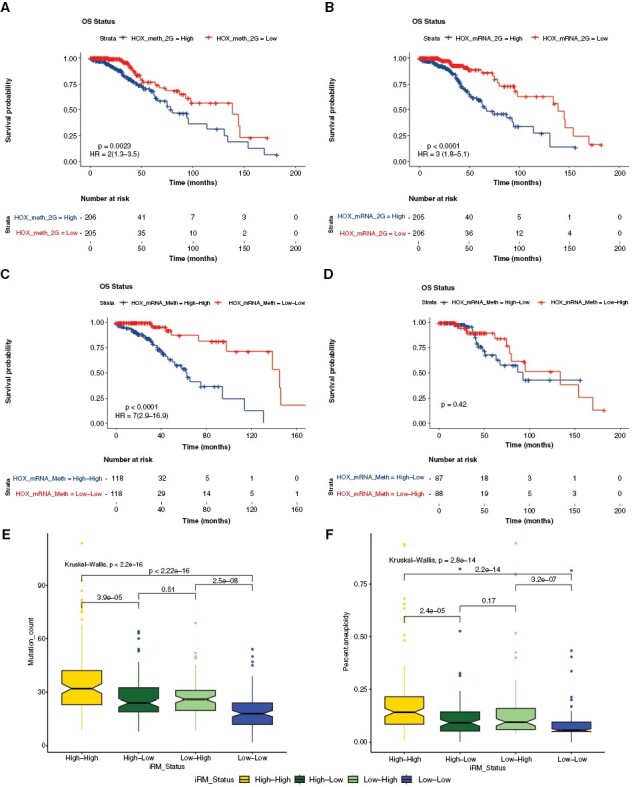
Characterization and integration of all HOX gene methylation and gene expression. HOX gene-specific methylation and gene expression patterns in similar directionality are related to patient survival. (A) Kaplan–Meier diagram showing overall survival based on HOX gene methylation pattern (hypermethylation vs. hypomethylation) with hazard ratios (95% Confidence Interval: CI). (B) Kaplan–Meier survival analysis based on expression of HOX genes with hazard ratios (95% CI). (C) Kaplan–Meier diagram with the survival statistics of integrative RNA-methylation (iRM) subtypes of similar directionality of HOX gene methylation and HOX gene expression (iRM high and iRM low). (D) Kaplan–Meier diagram with survival statistics of iRM subtypes of opposite directionality of HOX gene methylation and HOX gene expression. (E) Boxplot showing the association of these integrative subtypes with mutational rate. (F) Boxplot showing the association of these integrative subtypes with aneuploidy.
