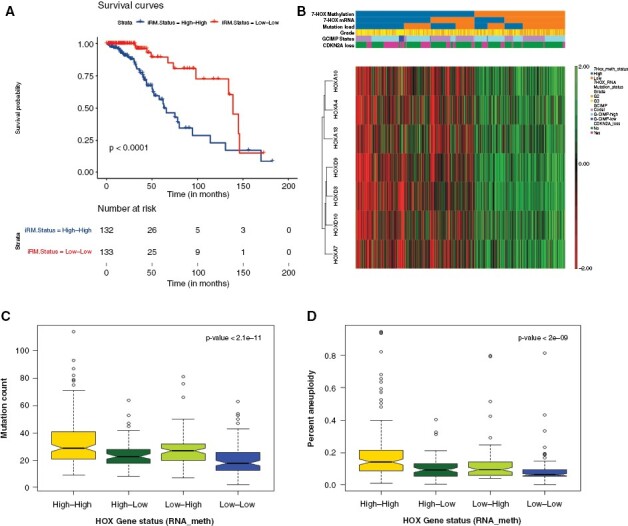
Figure 3.

7-HOX genes as biomarkers of outcome in IDH-mutant gliomas. (A) Kaplan–Meier diagram for integrated RNA and methylation analysis of 7-HOX gene signature (signed average of HOX gene methylation and HOX gene expression). (B) Unsupervised Hierarchical clustering and dendrogram for IDHmut glioma types for mRNA and methylation, where heatmap is only for the methylation data for 7-HOX genes. (C) Boxplot showing the associations of these integrative subtypes with mutational rate. (D) Boxplot showing the associations of these integrative subtypes with aneuploidy.
