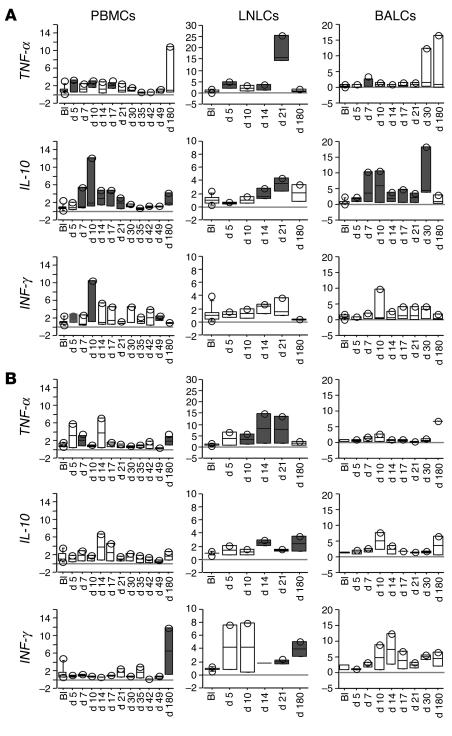
Figure 5.
IL-10, TNF-α, and IFN-γ gene expressions in PBMCs, LNLC, and BALCs of 3 SIVagm-infected AGMs (SAB98007, SAB98008, and SAB98011) (A) and 2 mock-infected AGMs (SAB98001 and SAB98006) (B). Gray boxes indicate statistically significant increases (P < 0.05, Wilcoxon signed rank test) as compared with preinfection baseline values. See also legend to Figure 4.

