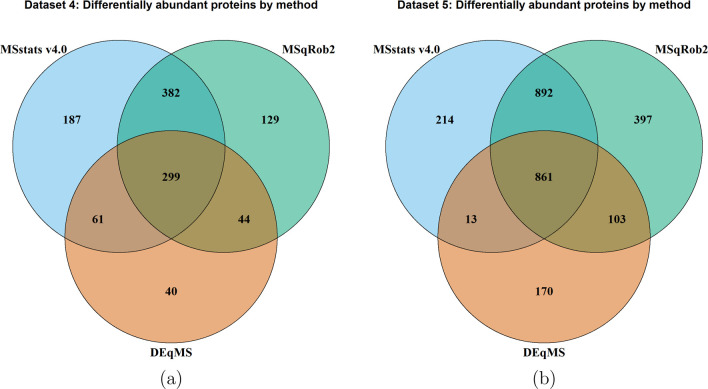
Figure 9.
Data sets 4 and 5: Statistical analyses by MSstats v4.0, MSqRob, and DEqMS. (a) Data set 4: Mouse–DDA–MaxQuant. MSstats and MSqRob show a large overlap of differentially abundant proteins, with MSstats reporting more differentially abundant proteins in total. DEqMS produced the least differentially abundant proteins, with most of those reported also reported by the other methods. (b) Data set 5: S. cerevisiae–DIA–Skyline. MSstats and MSqRob show a large overlap of differentially abundant proteins, however MSqRob reported more differentially abundant proteins in total than MSstats.

