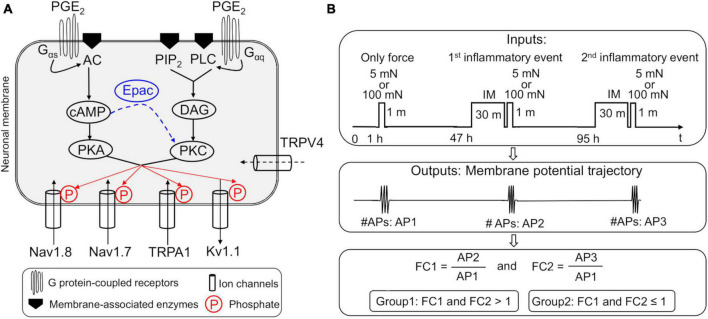
FIGURE 1.
(A) Implementation of two parallel inflammation-induced G protein-coupled receptor (GPCR) signaling pathways in our nociceptive muscle neuron model. Shown are the four modeled neuronal transmembrane proteins, Nav1.8, Nav1.7, Kv1.1, and TRPA1, whose activation and inactivation kinetics are modified by protein kinases C (PKC) and A (PKA), which are activated by the two prostaglandin E2 (PGE2)-initiated intracellular signaling pathways in the model. The arrows of the ion channels indicate the direction of flow of the ions through the corresponding channel. In the first pathway, phosphorylation of the GPCR activates subunits Gαq, β, and γ of the receptor. The Gαq subunit activates membrane-bound phospholipase C (PLC) and phosphatidylinositol 4,5-bisphosphate (PIP2) to produce diacylglycerol (DAG), which in turn activates PKC. In the second pathway, phosphorylation of the GPCR activates subunits Gαs, β, and γ of the receptor. The Gαs subunit activates membrane-bound adenyl cyclase (AC) that activates cAMP, which in turn activates PKA. We also implemented the cAMP activation of Epac, which increases PKC activation (blue dashed arrow), thus providing feedback between the two inflammation-induced pathways. In addition, we added a mechanosensitive ion channel, TRPV4, previously not present in the model. Finally, we modeled the phosphorylation of Nav1.8, Nav1.7, Kv1.1, and TRPA1 by PKC and PKA, which modified their activation and inactivation kinetics. (B) Schematic showing the simulation inputs and outputs. In each simulation (one performed using the nominal parameter set and another using 50,000 distinct parameter sets generated for the global sensitivity analysis), we applied a step input of 5 or 100 mN mechanical force for 60 s at the simulation time point of 1 h. Next, at the 47- and 95-h simulation time points, we applied a step input of an inflammatory mediator (IM) at 100 nM for 30 min immediately followed by a 60-s step input of either 5 or 100 mN mechanical force. For each simulation that ran successfully, we used the time course of the membrane potential output to calculate the number of action potentials (APs) fired after the application of the mechanical force input once before (AP1) and twice after (AP2 and AP3) exposure to IM. Finally, we calculated the fold change in the number of APs fired after the first (FC1) and second (FC2) exposure to the IM, by dividing AP2 and AP3, respectively, by AP1. We classified the simulations where FC1 and FC2 were > 1 as primed neurons and those where FC1 and FC2 were ≤ 1 as non-primed neurons.

