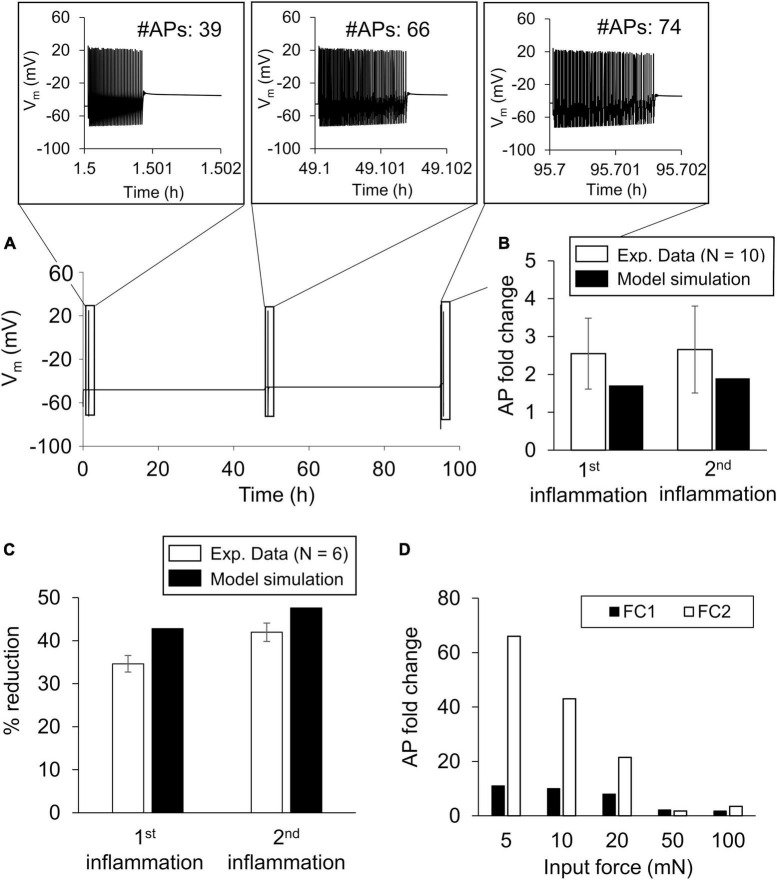
FIGURE 3.
Model validation. We validated the model by comparing the simulations of inflammation-induced action potential (AP) firing increase and mechanical threshold reduction with the corresponding experimental data. (A) Simulated time course trajectory of the membrane potential output in response to a 100 mN force applied before (at the 1-h time point) and after two subsequent inflammatory events (i.e., at the 47- and 95-h time points). The inset shows the number of APs generated and their magnitude. (B) Mean experimental data ± 1 standard error (SE) fold change in the number of APs fired in response to a noxious force after exposure to two subsequent inflammatory events in rat gastrocnemius muscle neurons (open bars, N = 10) (Hendrich et al., 2013). (C) Mean experimental data of the percentage reduction ± 1 SE in the mechanical threshold induced by two subsequent exposures to 100 nM PGE2 (open bars, N = 6). Solid bars in (B,C) show the corresponding model predictions. (D) Model predictions of the AP firing fold change in response to five different force stimulations after two inflammatory events. The fold changes after the first inflammatory event are referred to as FC1 and those after the second inflammatory event as FC2.

