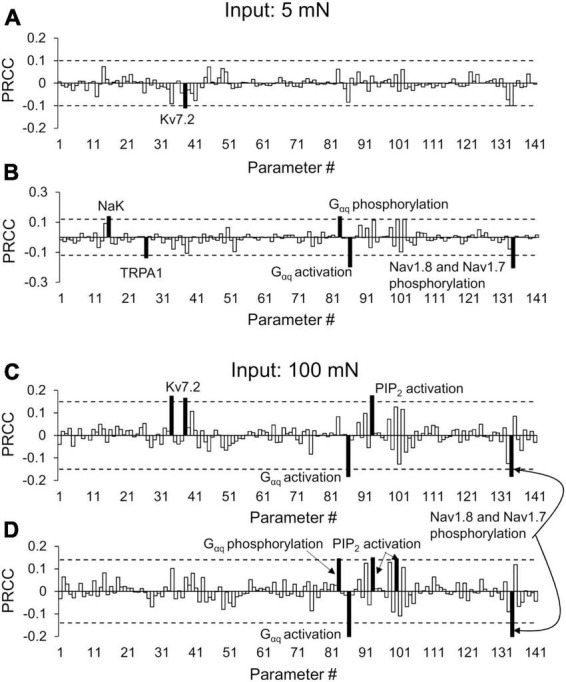
FIGURE 5.

Partial rank correlation coefficient (PRCC) analysis identified key proteins and processes for action potential (AP) regulation. The bars show the PRCCs of the 141 model parameters with fold changes in the total number of APs generated after the first (FC1) and second (FC2) inflammatory events in response to a mechanical force of 5 mN (A,B) and 100 mN (C,D) in the primed neuron simulations. The PRCCs above their respective thresholds (dotted horizontal lines) that were statistically significant (i.e., p < 0.01; p-values depict the probability of seeing the observed correlation if no correlation exists) are indicated by solid black bars, and the labels of the bars show the ion channels/ion pumps or the rates of intracellular processes that these parameters describe in the model. We used the Spearman’s rank correlation method to compute the PRCC values, and obtained the p-values of the correlation using a Student’s t-test. Because the data were not normally distributed, we used a large-sample approximation while performing this test. The analyses are based on 2,438 and 1,605 simulations classified as primed neurons for applied mechanical forces of 5 and 100 mN, respectively.
