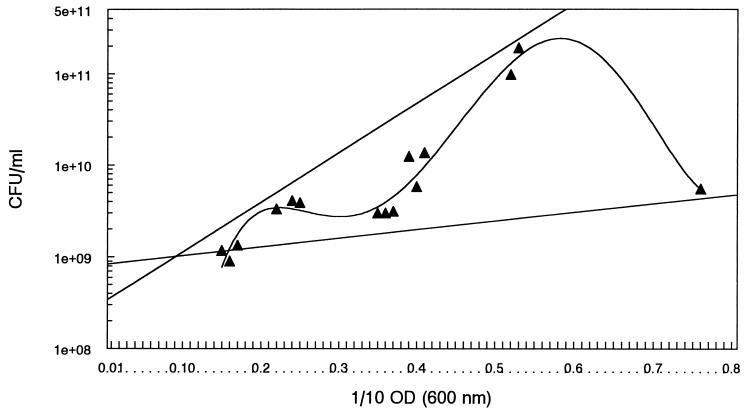
FIG. 3.
High-cell-density growth characteristics of SE-HCD. Straight lines, linear regression lines indicate observed highest and lowest boundaries for opacity versus cell density values after cultures attained a 0.1 1/10 opacity and 109 CFU/ml. Biphasic curvilinear line, data points generated during growth curve analysis conducted in triplicate were analyzed by curvilinear analysis (fifth polynomial). Closed triangles, opacity of cells diluted 10-fold (1/10 OD). Swarming migration can be detected by passaging cells to agar at a 1/10 OD of 0.5.

