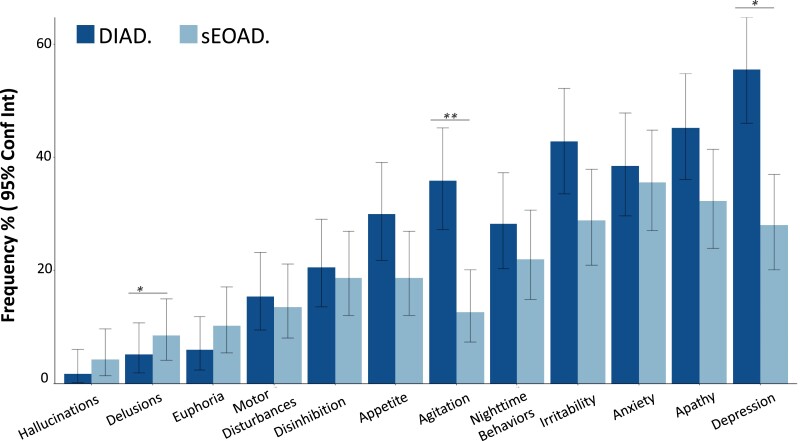
Figure 1.
NPI-Q: sEOAD versus DIAD. (A) Percentage of respondents endorsing each item of the NPI-Q among DIAD (n = 117) and sEOAD (n = 118) cohorts. The P-values for comparing the two cohorts are calculated from Fisher’s exact test: *P = 0.01; **P = 0.001. Absolute number, percentage and associated P-values are shown in Supplementary Table 2. Conf Int, confidence interval.

