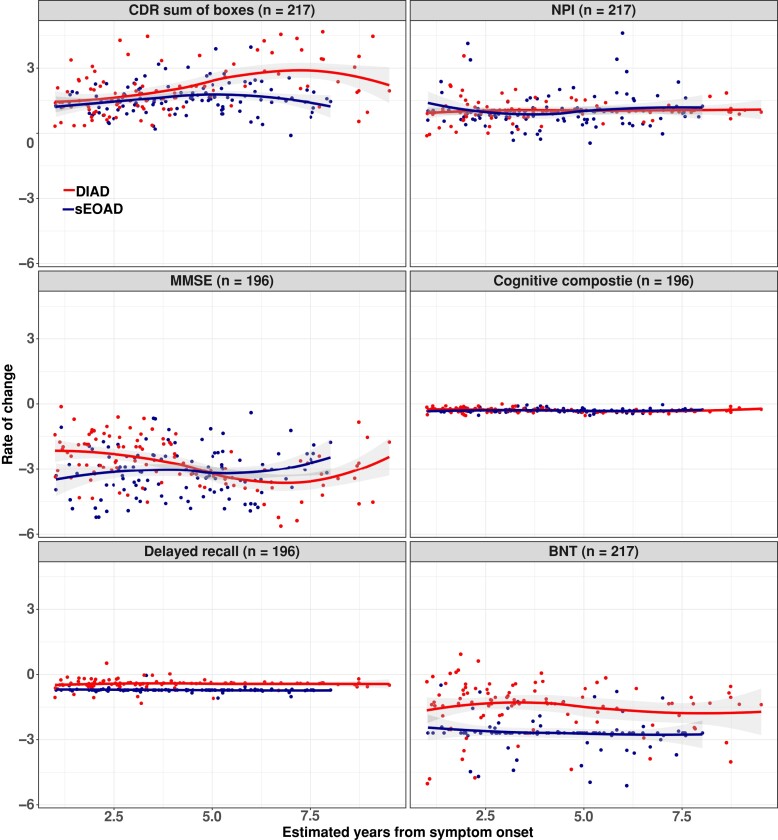
Figure 2.
Estimated mean rate of change from baseline with standard error for DIAD and sEOAD groups. (A) CDR-SB scores range from 0 to 18, with higher scores indicating worse cognition and daily function (DIAD versus sEOAD, P = NS; 0.04 at EYO = 10). (B) NPI-Q with higher scores indicating high burden of neuropsychiatric symptoms (DIAD versus sEOAD, P = NS). (C) MMSE with lower scores indicating worse cognition (DIAD versus sEOAD, P = <0.05; NS at EYO = 5). (D) Global cognitive composite, with lower scores indicating worse cognition (DIAD versus sEOAD, P = NS). (E) Logical memory: logical memory delayed recall, scores range from 0 to 25, with lower scores indicating poorer cognitive performance (DIAD versus sEOAD, P = NS). (F) Boston Naming Test (BNT) with lower scores indicating poorer cognitive performance (DIAD versus sEOAD, P = NS). Observed values from DIAD and sEOAD cohorts were represented by red and blue dots, respectively. The temporal patterns of rate of change were shown by locally estimated scatter smoothing curves. Random intercept random slope mixed-effects models were fitted to compare the difference between DIAD and sDOAD cohorts after adjusting for baseline EYO, sex, education and APOE4 status. Mean values and corresponding coefficient’s Wald t-test P-values. Mean values and corresponding coefficient’s Wald t-test P-values are shown in Table 3. Mean values for DIAD versus sEOAD amnestic and sEOAD non-amnestic are shown Table S1. NS, not significant.

