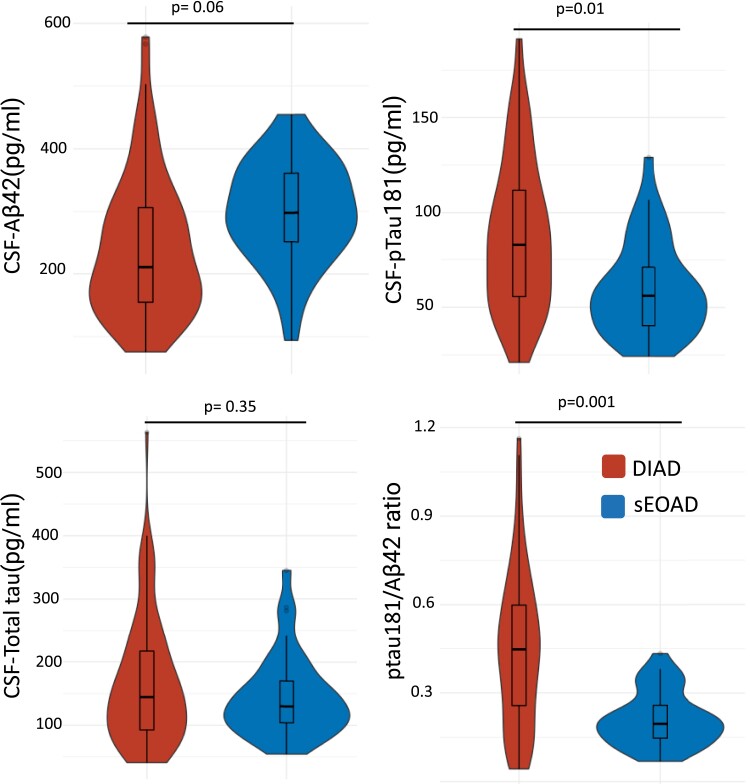
Figure 3.
CSF biomarkers of amyloid, tau and phosphorylated tau at threonine 181. Biomarkers included (A) Aβ42, (B) p-tau181, (C) total tau and (D) pTau181/Aβ42. The central horizontal bar shows the median value, and the lower and upper boundaries show the SD. DIAD (n = 91); sEOAD (n = 37). Absolute mean differences, SD and associated P-values of ANOVA F-test are shown in Supplementary Table 4. P-value adjusted for CDR, age and APOEe4 status. Both cohorts used the same lab procedures and assays but were run in different batches using different lot numbers.

