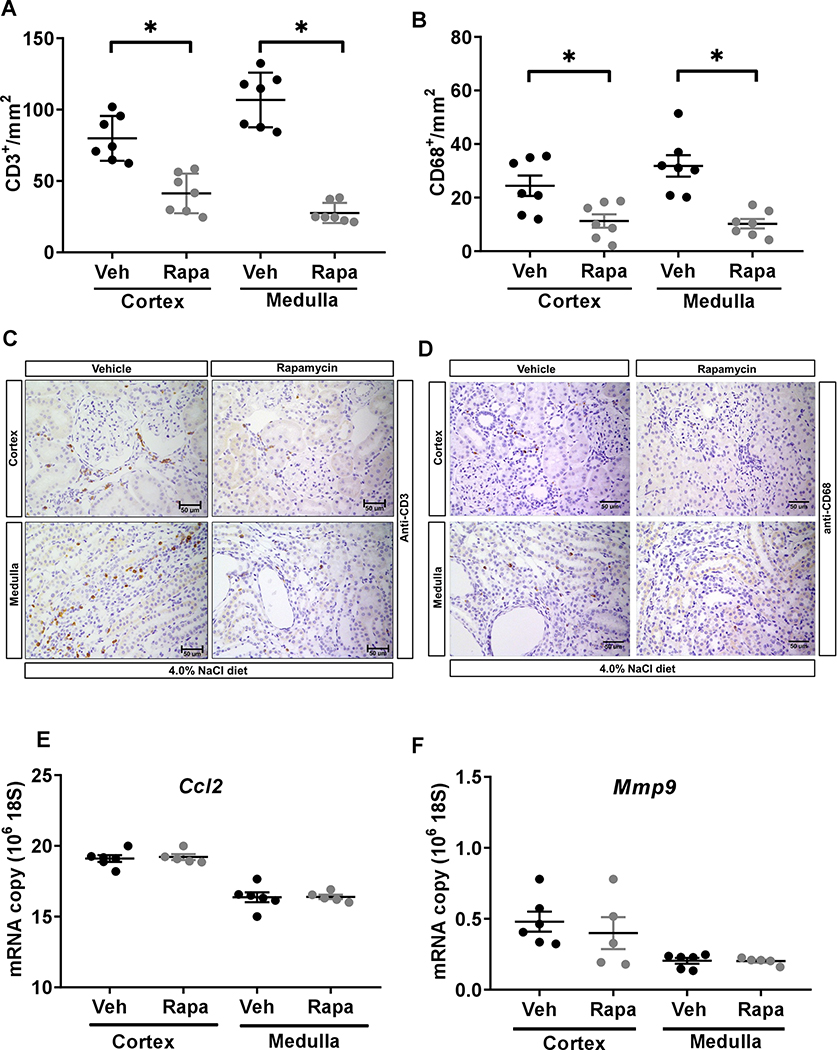
Figure 5:
A-D, quantification of T lymphocyte (CD3+) and macrophage (CD68+) cells per mm2 of kidneys of vehicle (n=7) or rapamycin (n=7) treated SSNox4−/− rats. (A&C) CD3+ cells/mm2 and (B&D) CD68+ cells/mm2 in the renal cortex and medulla and representative kidney sections illustrating the immunohistochemical localization of T lymphocyte and macrophage cells in the kidney of these rats. Scale bar 50 μM. E&F, Quantitative polymerase chain reaction assessment of Ccl2 and Mmp9 in the cortex and medulla of vehicle (n=6) or rapamycin (n=5) treated SSNox4−/− rats. Unpaired t-test was used to compare the effect of treatments. * P<0.05.

