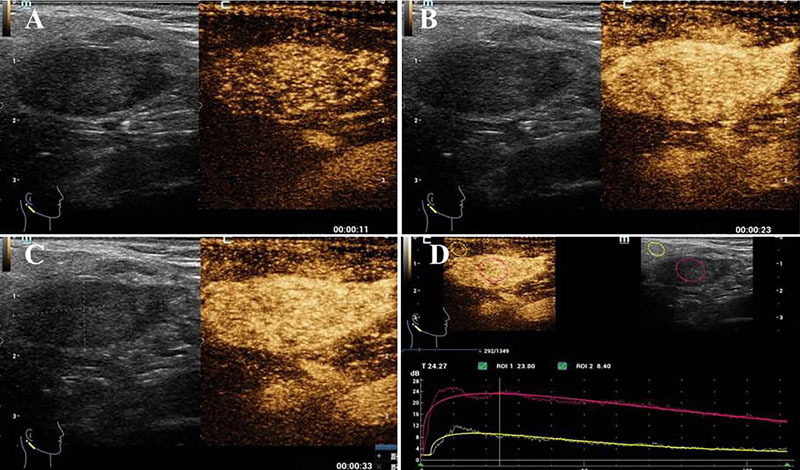
Fig. 3.

Images of Warthin tumor in the right lobe of a 53-year-old male. The CEUS showed the lesion with a clear margin, homogeneous hyperenhancement, and the perfusion pattern of “fast-in and slow-out” ( A -early phase, B -middle phase, and C -late phase). D Time-intensity curve analysis showed the perfusion kinetics of the lesion (red line) and surrounding tissue (yellow line). CEUS: contrast-enhanced ultrasound.
