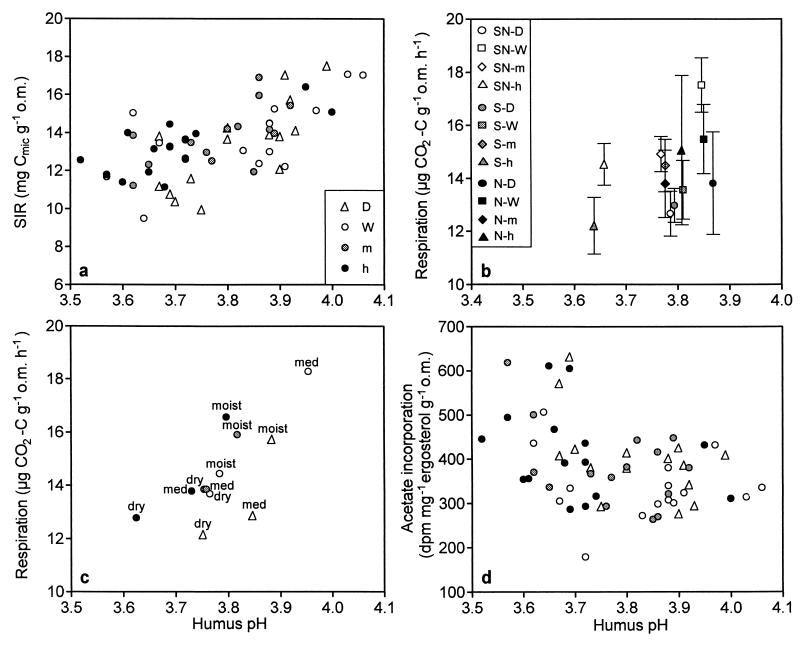
FIG. 1.
Effect of humus pH on total microbial biomass measured by SIR (a); basal respiration, where symbols indicate the mean for five replicate plots of the different treatments and bars indicate the standard error for the replicates (b); basal respiration, where symbols indicate the mean respiration level of the treatments situated within the same vegetation type, dry (dry), medium (med), or moist (moist) (c); and growth rate of fungi, estimated by [14C]acetate incorporation into ergosterol (d). Symbols for panels c and d are as described for panel a. o.m., organic matter.

