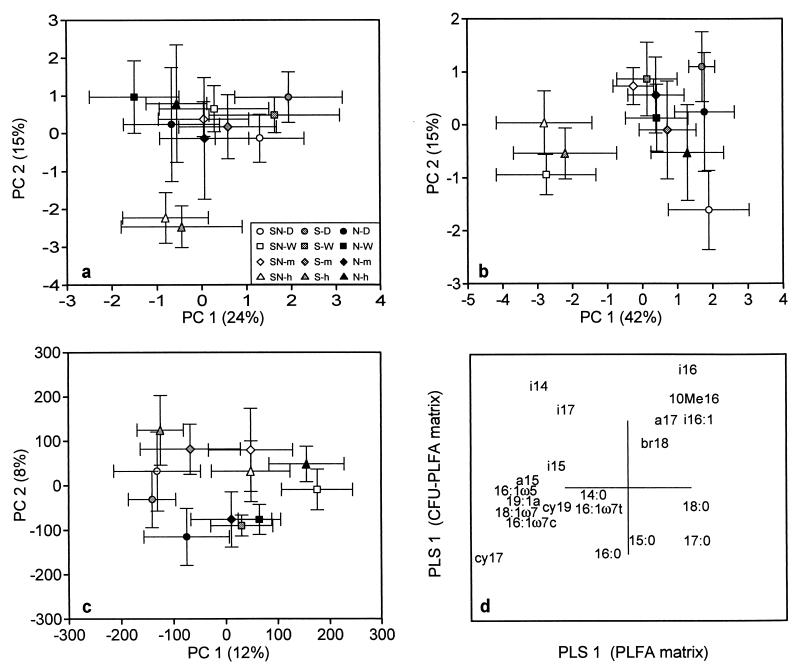
FIG. 2.
Score plot of PCA showing the separation of the study plots along PC 1 and PC 2 determined with humus PLFA data (a), plated-community PLFA data (CFU-PLFA) (b), Biolog GN analysis (c), and comparison of humus PLFA and plated-community PLFA analyses with PLS regression (d). Bars indicate the standard error for five replicate plots.

