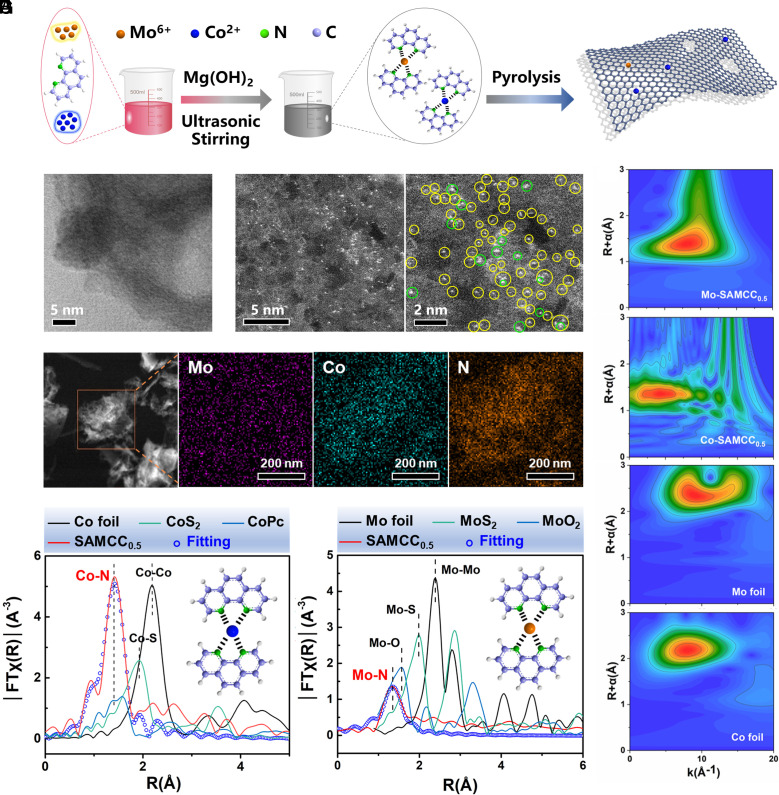
Fig. 1.
(A) Synthesis process of SAMCC0.5 and schematic diagram of the structure. (B) HRTEM image of SAMCC0.5. (C) Aberration-corrected HAADF-STEM image of SAMCC0.5: Yellow circles indicate single Co atoms, and green circles indicate single Mo atoms. The atomic number contrast indicates that the larger the atomic number, the brighter the image. Thus, atomic Mo will be brighter. (D) Elemental mapping for SAMCC0.5. (E) EXAFS in R-space and corresponding fitting curves for Co foil, CoS2, CoPc, and SAMCC0.5. (F) EXAFS in R-space and corresponding fitting curves for Mo foil, MoS2, MoO2, and SAMCC0.5. (G) WT-EXAFS for the Mo element of SAMCC0.5, Co element of SAMCC0.5, Mo foil, and Co foil.

