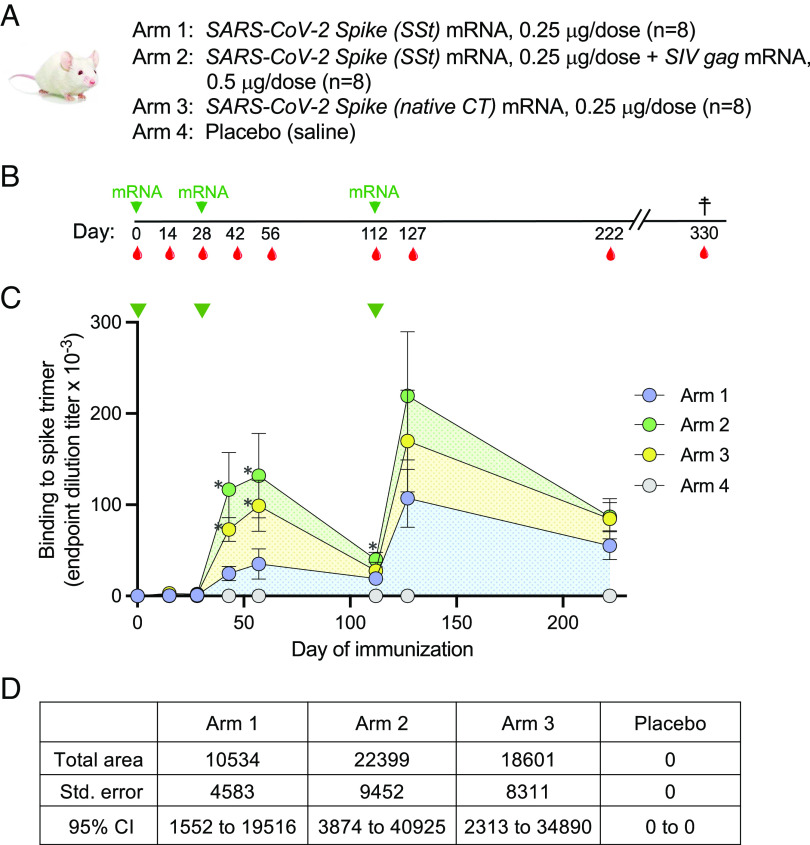
Fig. 2.
(A) Design of the mouse immunization study. Each study arm included eight wild-type BALB/c mice. (B) Sequence of mRNA immunizations (green arrows) and bleedings (red drops). (C) Induction of SARS-CoV-2 Spike-binding antibodies in the four study arms over time, as assessed by ELISA on plastic-immobilized Wuhan-Hu-1 Spike trimers. The time of immunization is indicated by the green arrows at the top. The data represent mean values from each study arm (±SEM). The asterisks indicate a P-value below 0.05 as tested by the unpaired nonparametric two-tailed t test (Mann–Whitney). (D) Calculated area under the curve for the level of Spike-binding antibodies shown in (C).

