
Fig. 3. Defining the scRNA-transcriptome associated with Treg tumor antigen reactivity using a transgenic TCR mouse model.
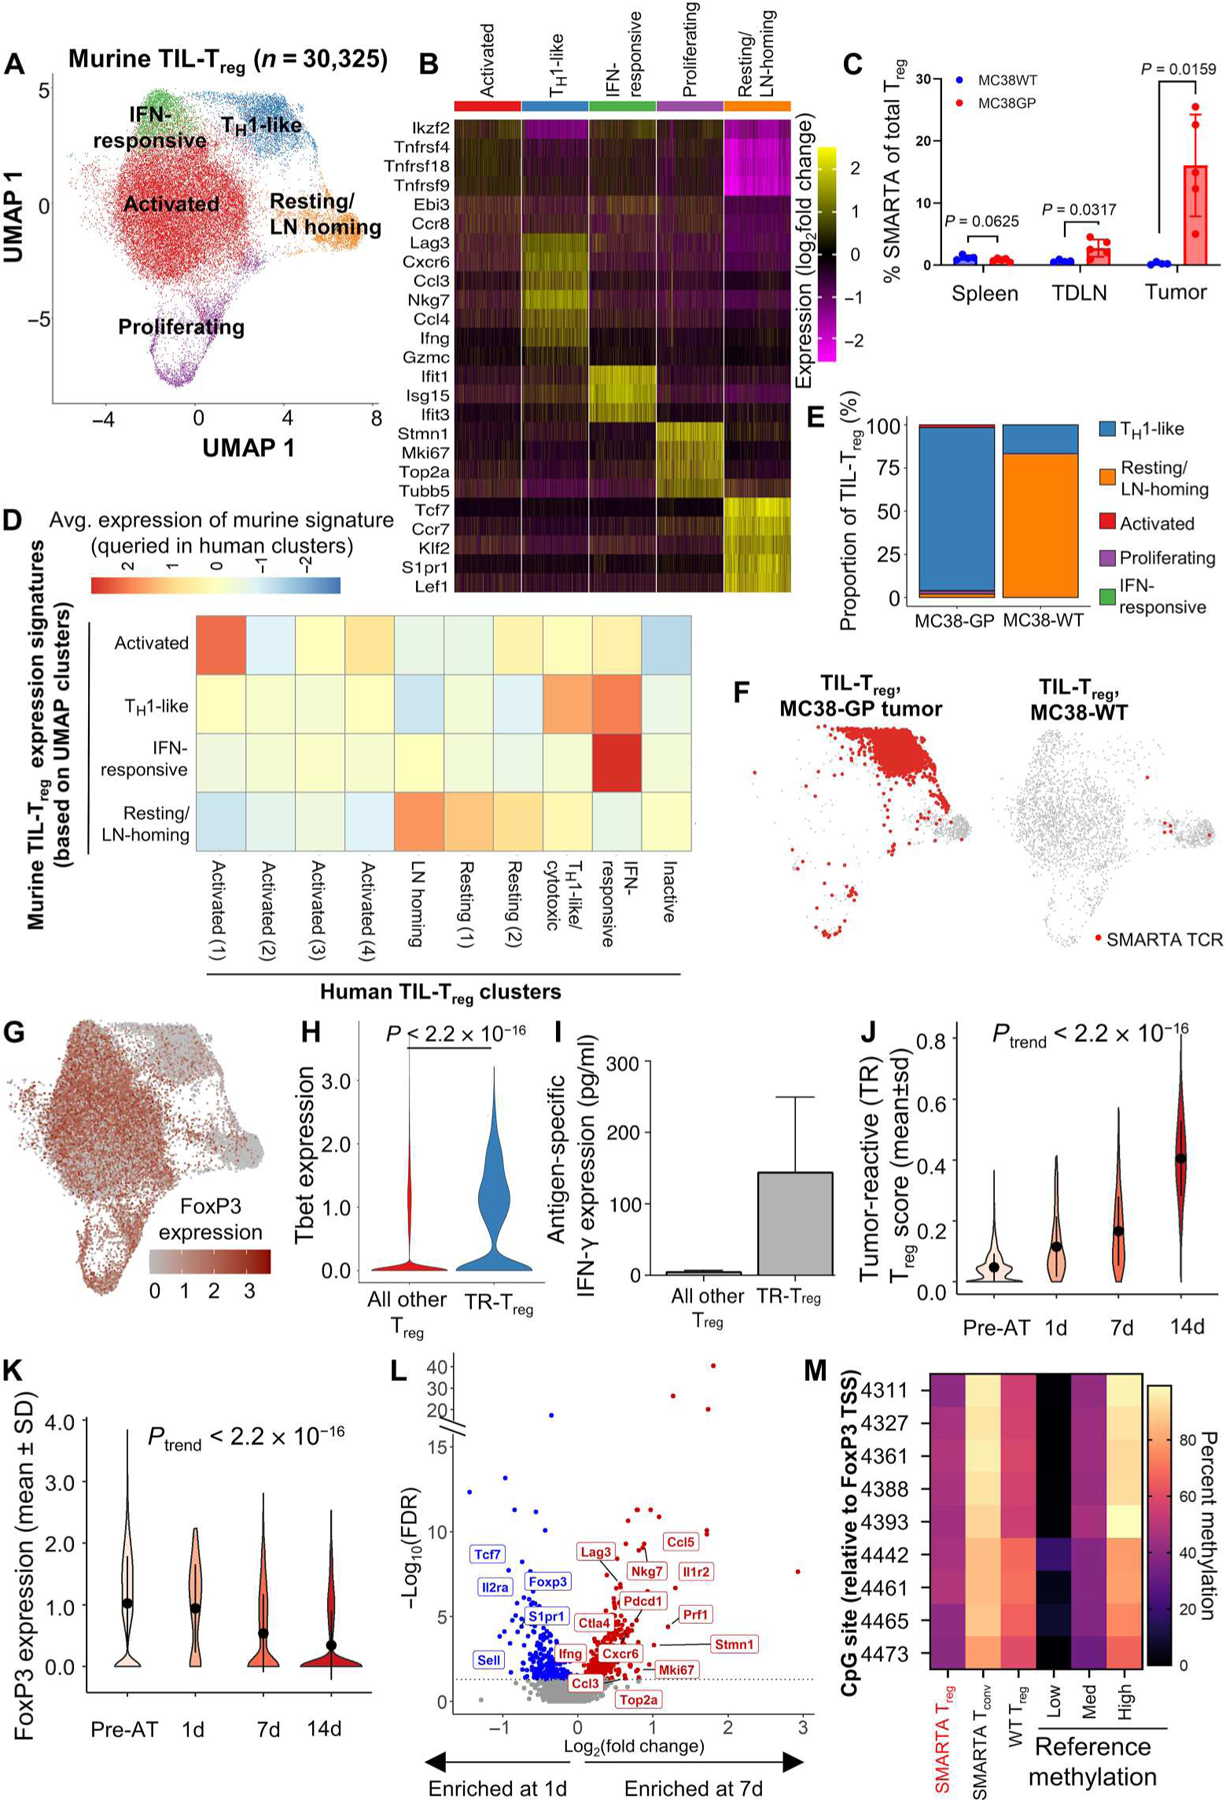
Coupled scRNA-seq/TCR-seq was performed on Treg isolated from GP-expressing MC38 (MC38-GP, n = 5 mice per experiment) or parental MC38 (MC38WT, n = 10 mice per experiment) tumors, tumor-draining inguinal lymph node, and spleens on day 14 of tumor growth. (A) 2D UMAP projection of the expression profiles of the 30,325 Treg that passed QC. Treg subsets, defined by five unique clusters, are annotated and marked by color code. (B) Relative expression of three to five differential genes for each cluster is visualized on a heatmap. (C) Comparison of the frequency of SMARTA FoxP3+ Treg of total Treg defined by expression of CD45.1, FoxP3, and the SMARTA TCR between MC38WT (blue) and MC38-GP (red) tumor-bearing mice in each tissue compartment. Means with SEM error bars are shown for each mouse (n = 5). P values were obtained using Mann-Whitney test. (D) Homology to human Treg clusters is shown by the average expression of genes scores built on the top 20 differentially expressed genes for each murine cluster queried in human clusters. (E) Quantification of cluster designation for all SMARTA clones from WT and GP-expressing MC38. (F) Cluster localization for SMARTA clones is shown with SMARTA TCR (red) overlaid on full 2D UMAP (gray) of Treg isolated from MC38-GP (left) or MC38WT (right). (G) Averaged log2-transformed and library size–normalized FoxP3 expression values are shown. Visualized in red scale using full UMAP projection. (H) TBX21 (Tbet) expression is shown for TR-Treg (blue) and all other Treg (red) from the GP-expressing MC38 tumor after 14 days in vivo. (I) Five thousand TR-Treg and non–TR-Treg were sorted and cocultured ex vivo with 1000 dendritic cells loaded with the LCMV GP peptide for 48 hours. Supernatants were harvested and assayed for IFN-γ using the Meso Scale Discovery platform. Data are shown as IFN-γ production above background, defined as Treg cocultured with dendritic cells without peptide. Mann-Whitney test was used to compare average IFN-γ production between peptide-loaded and peptide-unloaded conditions (P = 0.33; n = 2). (J) Violin plot showing the TR-Treg score of adoptively transferred SMARTA TCRpos Treg before adoptive transfer (pre-AT) and at 1, 7, and 14 days of tumor residence. (K) Violin plot showing FoxP3 expression by adoptively transferred SMARTA TCR+ Treg before adoptive transfer (pre-AT) and at 1, 7, and 14 days of tumor residence. P values obtained by Student’s t test. The P value of the trend (Ptrend) was calculated for the TR-Treg score and normalized Foxp3 expression over time by testing the linear regression slope with null and alternative hypotheses: H0: β1 = 0 (the slope is equal to zero), HA: β1 ≠ 0 (the slope is not equal to zero). N = 5 to 10 mice per time point. (L) Volcano plots showing differentially expressed genes of SMARTA TCR+ Treg in day 7 versus day 1. X axis shows log2(fold change), and y axis shows −log10(FDR). Differentially expressed genes higher at day 7 are shown in red, and differentially expressed genes higher in 1 day are shown in blue. (M) TSDR methylation profile of sorted SMARTA TCR+CD25hiRFP+ Treg from female SMARTA;RIP-GP mice compared with control values (low, medium, and high). Residue numbers denote individual CpG motifs in reference to the transcription initiation site of FoxP3. Data are an average of n = 2 experimental replicates with cells from n = 3 mice pooled per experiment. Bar colors represent 0 to 100% methylation.