
Fig. 1.
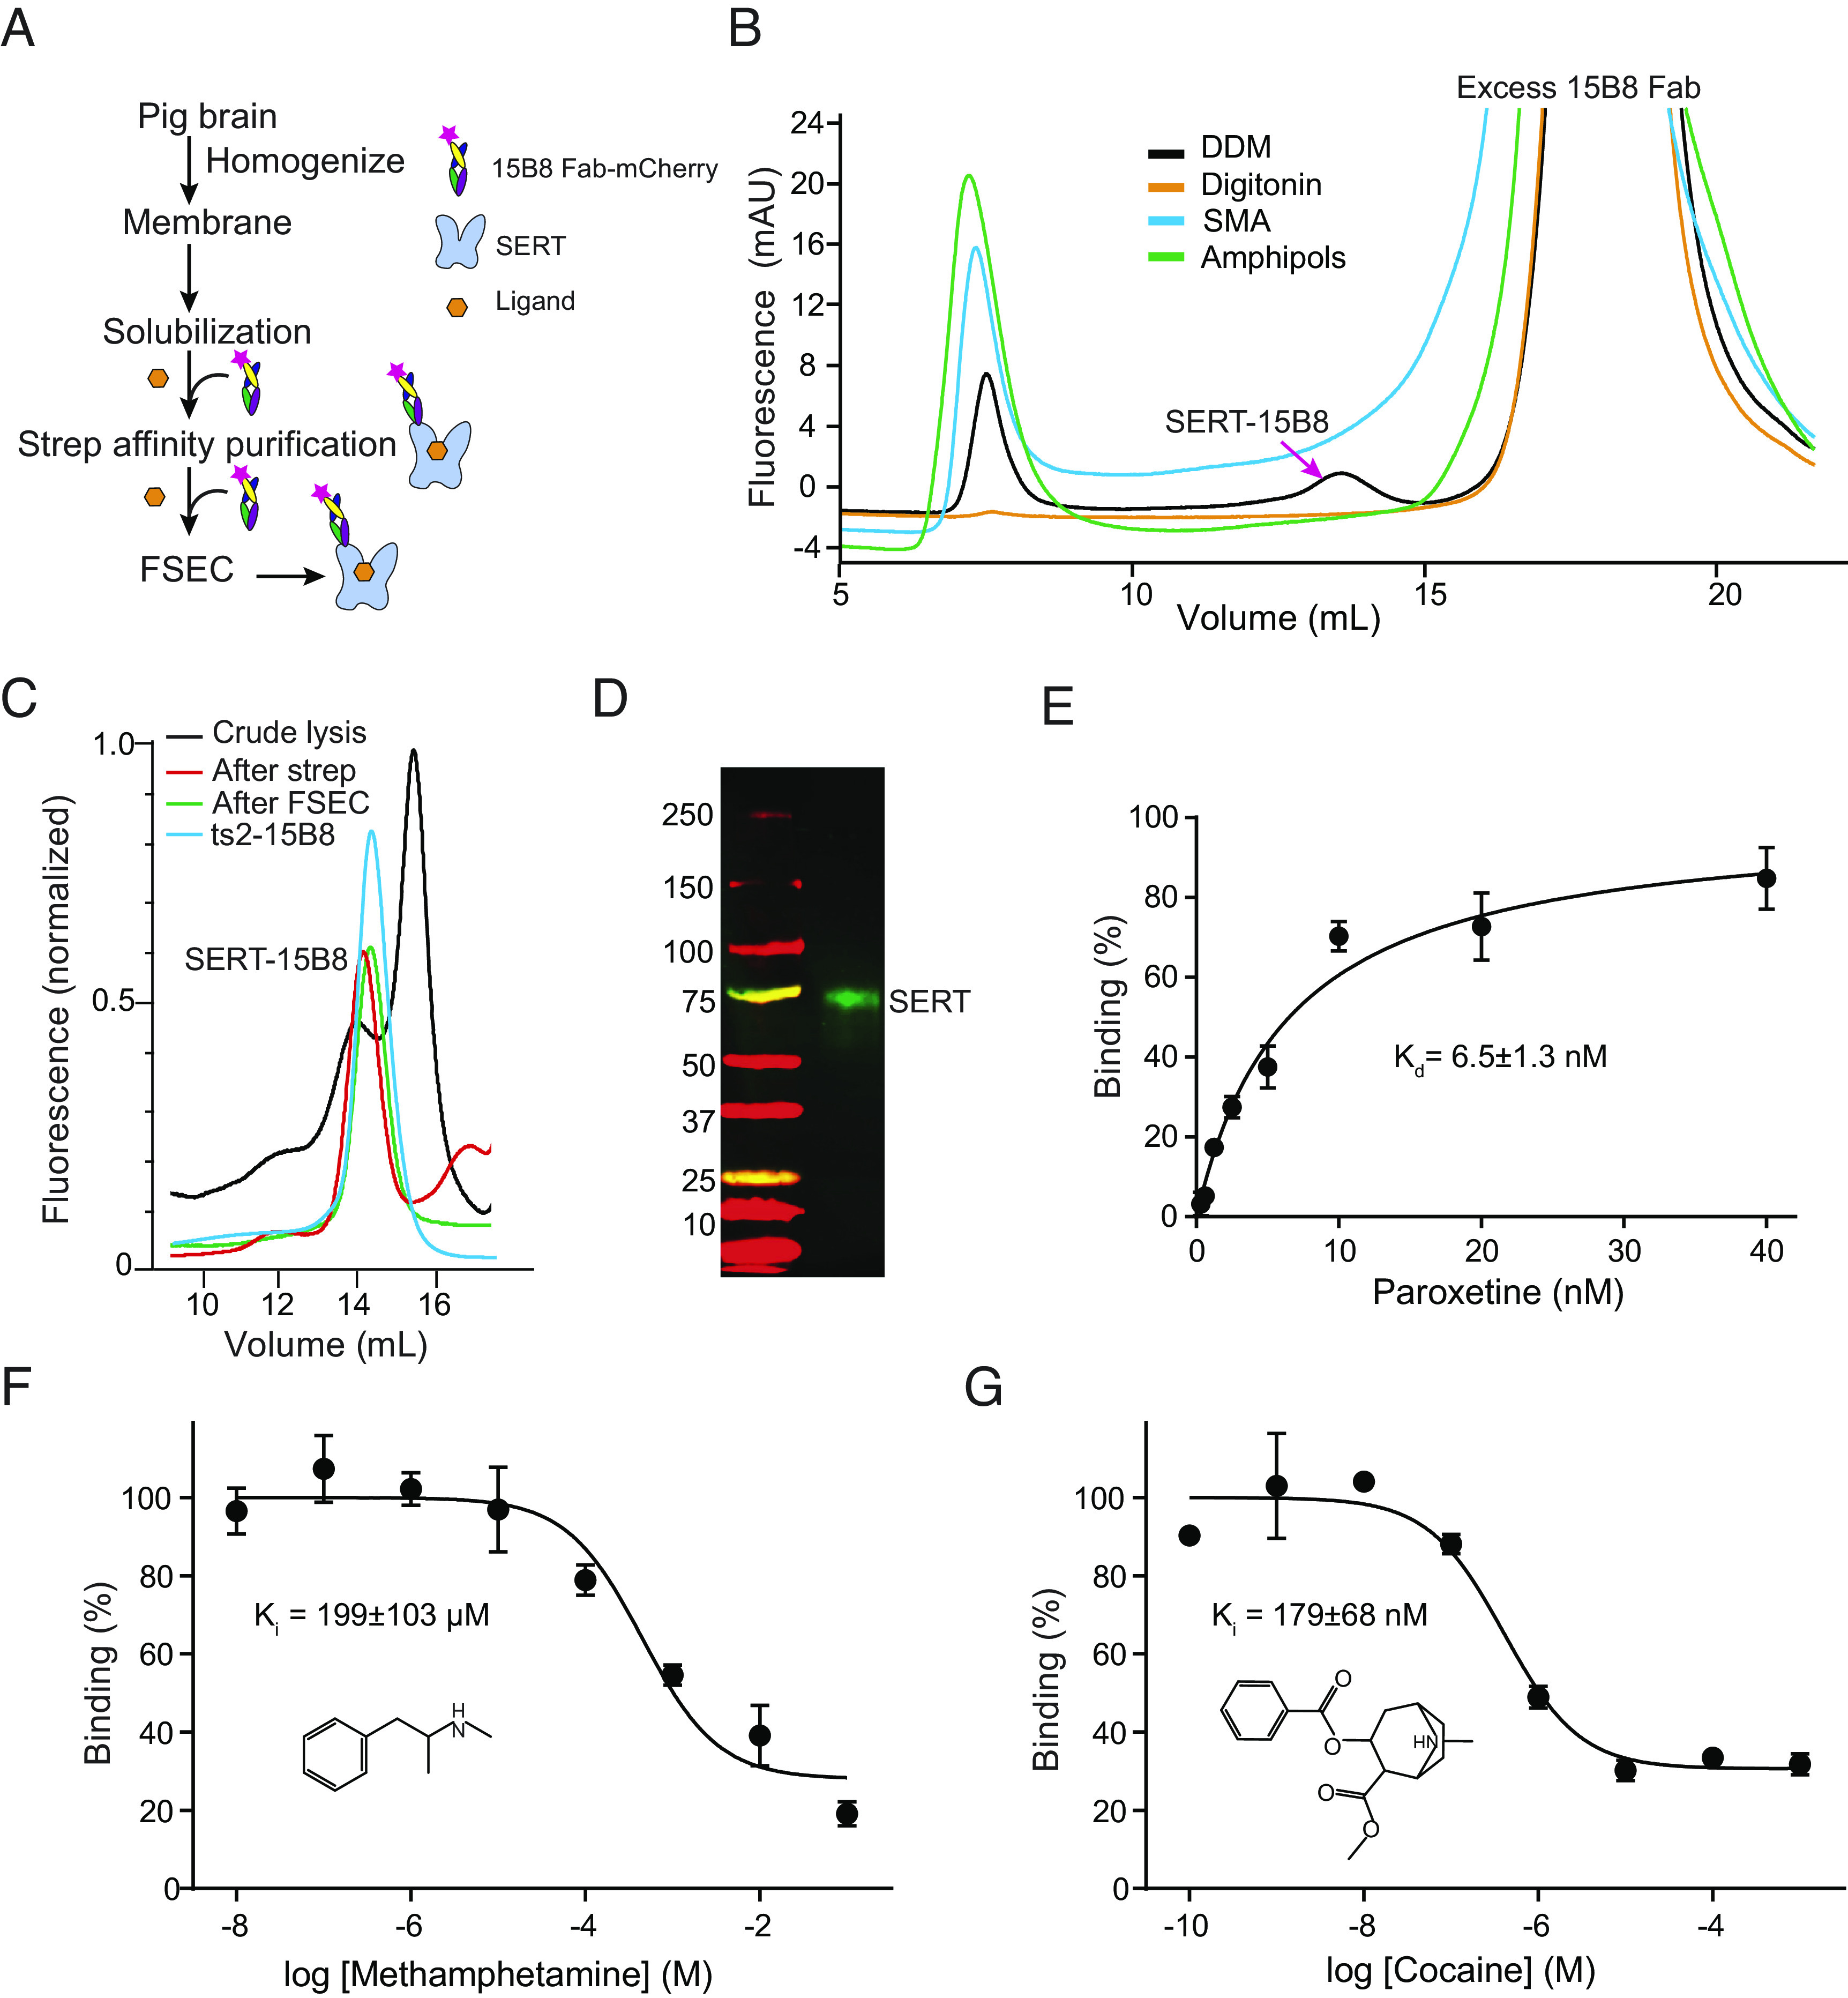
Purification and biochemical analysis of pSERT from native membranes. (A) Flow chart for pSERT purification. (B) FSEC profiles for screening of solubilization conditions. (C) Representative FSEC profile for pSERT in complex with the 15B8 Fab. (D) Western blot analysis of isolated pSERT after FSEC. The experiments were repeated two times with similar results. (E) Saturation binding of [3H] paroxetine to pSERT. (F) Competition binding of (+)-methamphetamine with [3H]paroxetine for pSERT. Symbols show the mean values derived from n = 3 technical replicates. Error bars show the SEM. (G) Plots of competition binding of cocaine against [3H]paroxetine for pSERT. Data are means ± SEM.