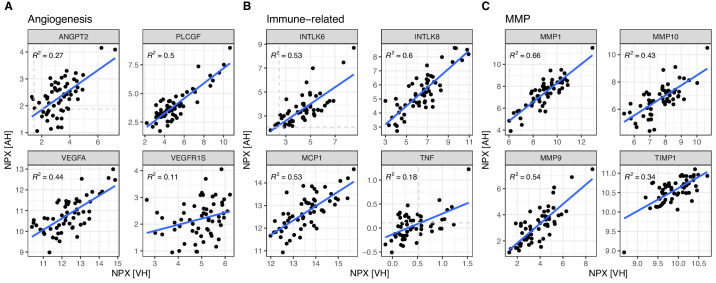
Figure 3.
Selected examples relevant to ocular biology. Scatterplots of the protein quantities (NPX) in AH and VH. Blue lines show linear fit. Spearman correlation R2 values are indicated. (A) Angiogenesis regulators: ANGPT2 (ANG-2), PLCGF (PGF; PlGF), VEGFA, and VEGFR1S (FLT1). (B) Immune-related proteins: INTLK6 (IL-6), INTLK8 (IL-8), MCP-1 (CCL2), and TNF (TNF-alpha). (C) Matrix metalloproteinases/MMPs: MMP1, MMP10, MMP9, and TIMP1.

