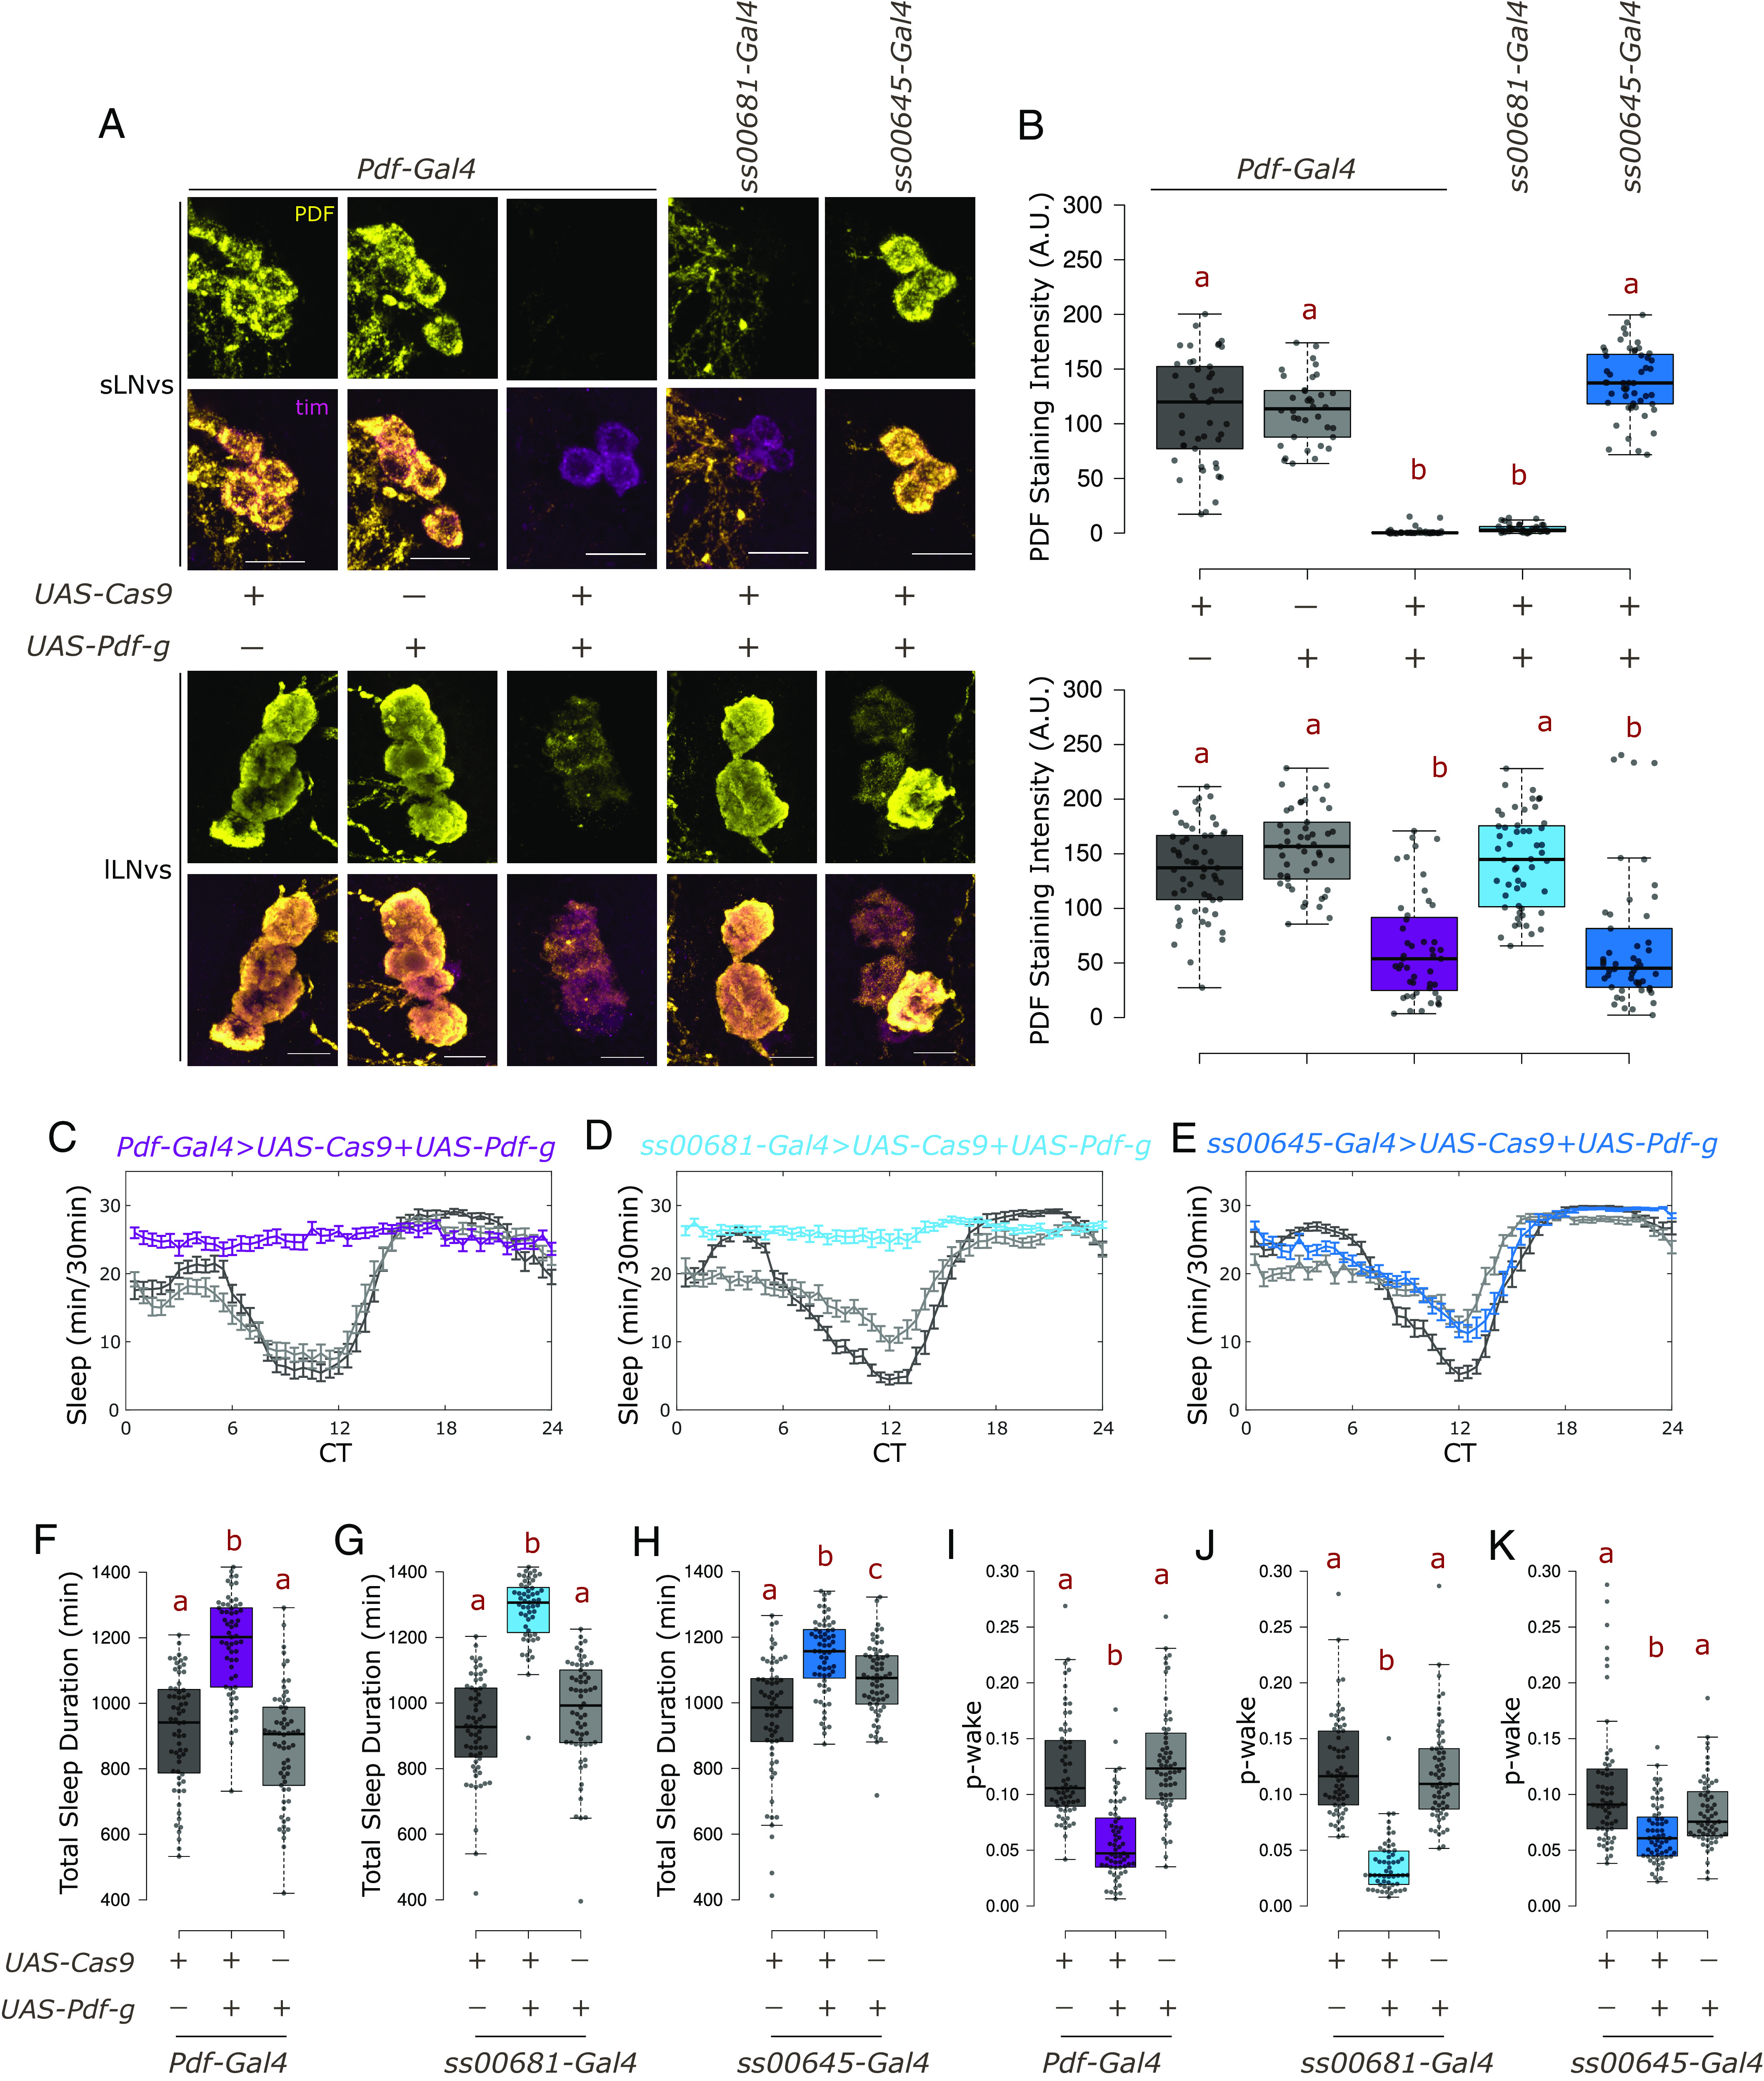
Fig. 3.

PDF from sLNvs maintains wakefulness under constant darkness. (A) Representative images of sLNvs (Top) and lLNvs (Bottom) stained for TIM and PDF at ZT18. TIM labels all clock neurons. There is loss of PDF staining in cells expressing both UAS-Cas9 and UAS-3×-guides against Pdf (UAS-Pdf-g). (The scale bar represents 10 µm.) (B) Quantification of PDF staining intensity from sLNv (Top) and lLNv (Bottom) neurons represented with boxplots, n ≥ 36 cells from at least 11 hemibrains per genotype. Letters represent statistically distinct groups; P < 0.001, Kruskal–Wallis test followed by a post hoc Dunn’s test. (C–E) Sleep plots representing average sleep of flies from DD1-4 in 30-min bins. UAS-Cas9 alone control is indicated in dark gray, UAS-Pdf-g alone control in light gray whereas the experimental genotype expressing both is represented by color indicated above the plots. (F–H) Total sleep duration in a day for individual flies quantified (from DD1-4) represented by a boxplot, n ≥ 55 per genotype from at least two independent experiments. Letters represent statistically distinct groups, P < 0.01; Kruskal–Wallis test followed by a post hoc Dunn’s test. (I–K) p-wake over a 24-h period for individual flies quantified (from DD1-4) represented by a boxplot, letters represent statistically distinct groups; P < 0.001, Kruskal–Wallis test followed by a post hoc Dunn’s test.
