
Fig. 2.
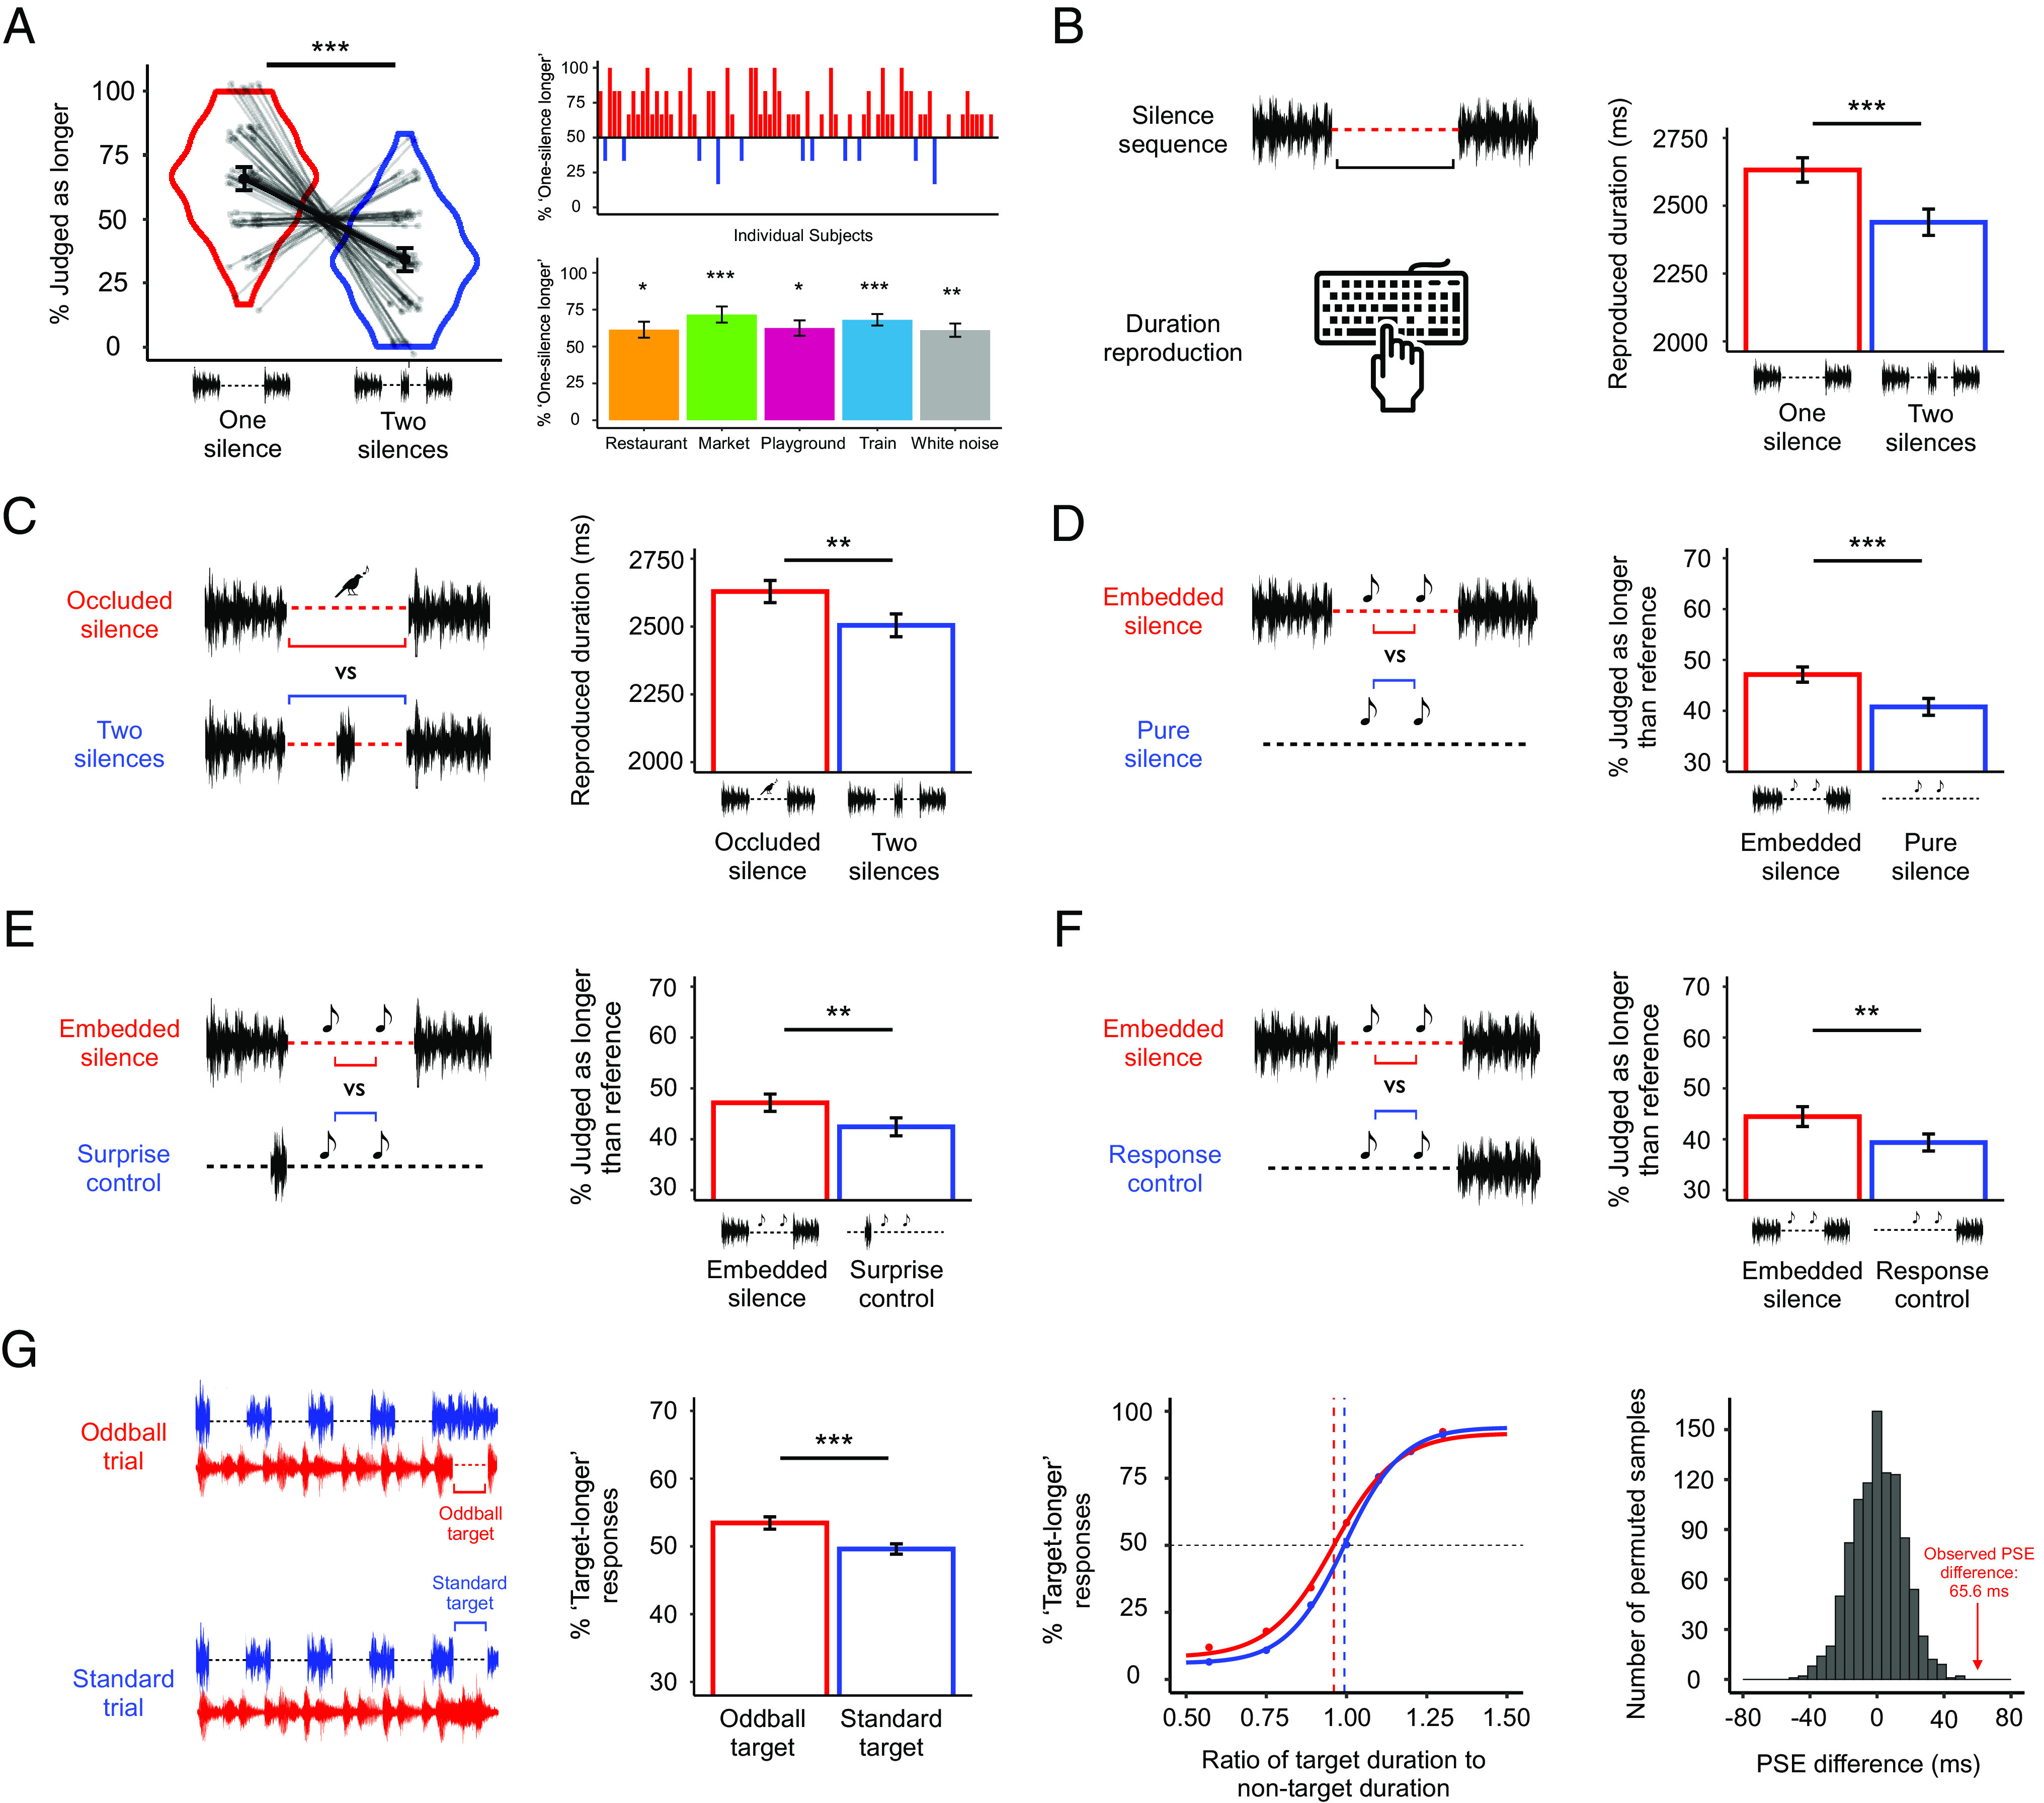
Results for Experiments 1 to 7. (A) Experiment 1 results. (Left) Percentage of “longer” responses during equal-duration trials, collapsed across subjects and ambient noise conditions. (Top Right) Percentage of “one-silence longer” responses for each subject. (Bottom Right) Percentage of “one-silence longer” responses for each ambient noise condition. Error bars represent 95% CI. (B) Experiment 2. When asked to reproduce the durations of silence sequences (rather than make forced-choice responses), a similar pattern of results emerged. Error bars represent SEM. (C) Experiment 3. (Left) Addition of an “occluded silence” condition, which contained an intervening noise that was not a resumption, but a different noise altogether (a bird chirp) played over a single continuous silence. (Right) Mean reproduced duration by sequence type. Error bars represent SEM. (D) Experiment 4. (Left) Subjects experienced two test tones in either embedded silence or pure silence, and judged whether the duration between the two test tones was longer or shorter than a previously memorized reference duration. (Right) Percentage of “longer than reference duration” responses by silence type. Error bars represent SEM. (E) Experiment 5. (Left) To control for any surprise caused by the offset of ambient noise in embedded silence, surprise control trials included a brief burst of white noise. (Right) Percentage of “longer than reference duration” responses by silence type. Error bars represent SEM. (F) Experiment 6. (Left) To control for differences in response conditions, response control trials included onset of the ambient noise after the test tones, during response. (Right) Percentage of “longer than reference duration” responses by silence type. Error bars represent SEM. (G) Experiment 7. (Leftmost) On each trial, subjects heard four identical nontarget silences, in which one soundtrack went silent for a fixed duration; thereafter, subjects heard a target silence, which was either a standard silence (in which the same sound went silent again), or an oddball silence (in which the other sound went silent). Subjects judged whether the target silence was longer or shorter than each of the nontargets. (Center-left) Proportion of “target-longer” responses by target type. Error bars represent SEM. (Center-right) Psychometric curves for standard targets (blue) and oddball targets (red). (Rightmost) Empirical null distribution of PSE differences between oddball and standard conditions from 1,000 permuted samples. The red arrow indicates observed PSE difference.