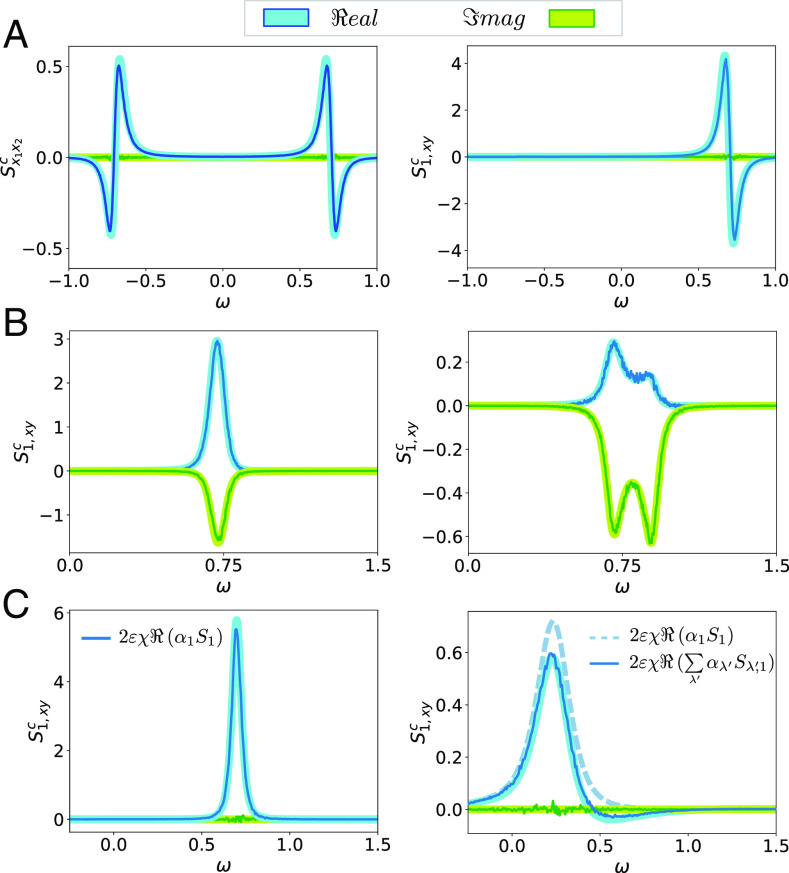
Fig. 5.
Cross-spectra of two coupled units for weak coupling strength ε = 0.01. In all panels, the thin (thick) lines indicate simulations (theory); blue (green) corresponds to real (imaginary) part. (A) For two harmonic oscillators with parameters as in Fig. 1, we show cross-spectra between the position variables of each oscillator (Left) and between the functions, . (B) For two symmetrically coupled but nonidentical Stuart–Landau oscillators, we show the cross-spectrum between the functions; Left: oscillators slightly detuned with one oscillator as in Fig. 1 and the other one with a changed value of b = −0.25; Right: the second oscillator is more strongly detuned with b = −0.1. (C) For two coupled identically SNIC systems, we show the cross-spectra with parameters as in Fig. 1 (Left) and Fig. 2 (Right). In the Right, two versions of the theory are shown: approximations by one mode (dashed line) and by the five leading terms (solid line, see text).

