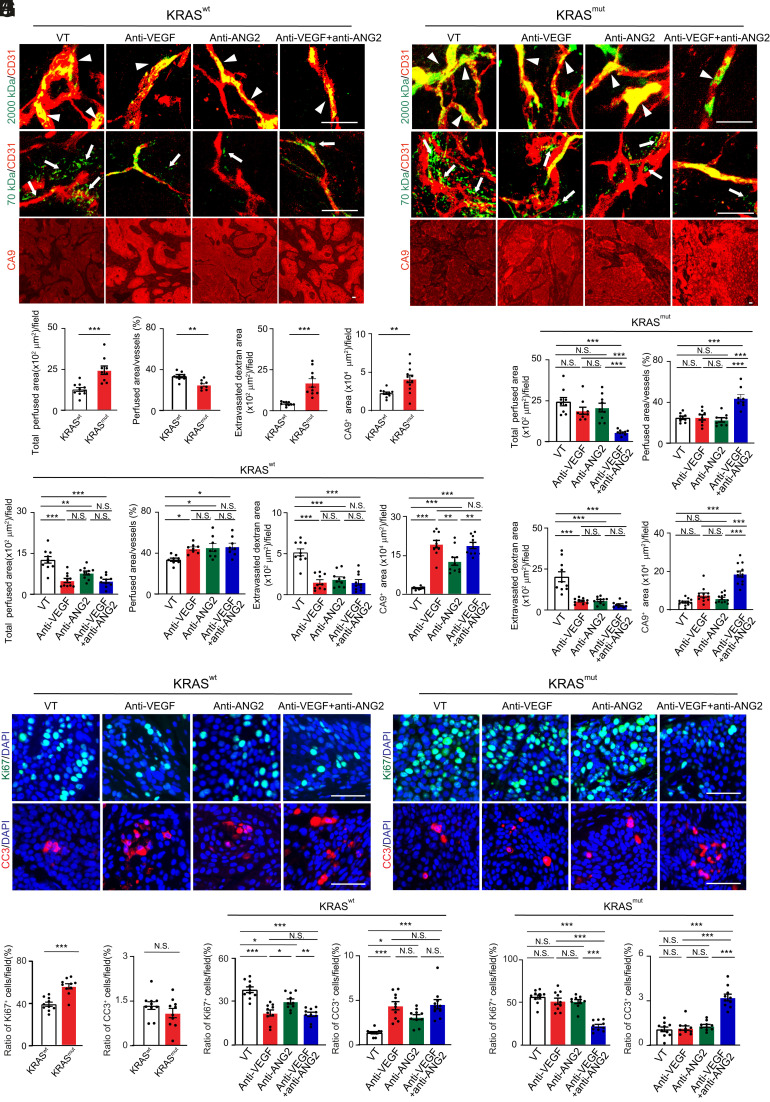
Fig. 5.
Tumor vessel functions, hypoxia, and antitumor effects in various antibody-treated KRAS mutant PDAC tumors. (A and B) Vessel perfusion and permeability were analyzed by injection of rhodamine-labeled lysine 2,000 kDa and 70 kDa dextran (green) in various antibody-treated BxPC3 KRAS wt (A) and KRAS mutant (B) tumors. Microvessels (red) are counterstained. CA9 signals represent hypoxia. (C) Quantification of vessel perfusion area and ratio, permeability, and CA9+ signals in BxPC3 KRAS wt and mutant tumors (n = 10 to 12 fields per group). (D and E) Quantification of vessel perfusion area and ratio, permeability, and CA9+ signals in various antibody-treated BxPC3 KRAS wt (D) and KRAS mutant (E) tumors (n = 10 to 12 fields per group). Vehicle-treated controls are the same as those in C. (F and G) Proliferative (Ki67) and apoptotic (CC3) cell signals in various antibody-treated BxPC3 KRAS wt (F) and KRAS mutant (G) tumors. Nuclei are counterstained with DAPI (blue). (H) Quantification of Ki67+ proliferative and CC3+ apoptotic cell signals in BxPC3 KRAS wt and mutant tumors (n = 10 fields per group). (I and J) Quantification of Ki67+ proliferative and CC3+ apoptotic cell signals in various antibody-treated BxPC3 KRAS wt (I) and KRAS mutant (J) tumors (n = 10 fields per group). Vehicle-treated controls are the same as those in H. All data represent mean ± SEM. (Scale bar, 50 μm.) Statistical analysis was performed using two-sided unpaired t tests (C and H) and one-way ANOVA followed by Tukey’s multiple comparison tests (D, E, I, and J). *P < 0.05, **P < 0.01, ***P < 0.001. N.S., not significant. CC3, cleaved caspase-3.

