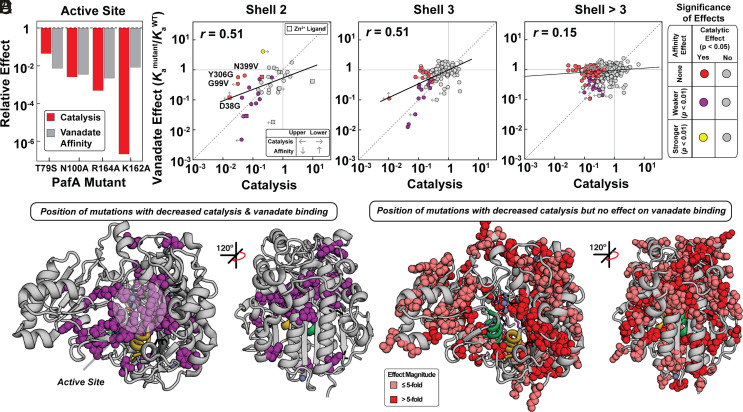
Fig. 3.
Effects of mutations on vanadate binding and catalysis as a function of distance from the PafA active site. (A) Comparison of catalytic and vanadate affinity effects for PafA active-site mutants, measured previously (51). (B–D) Comparison of catalytic (P < 0.05) and vanadate affinity effects (P < 0.01) for mutants of residues in the (B) second shell, (C) third shell, and (D) more distal shells. Labeled points in B denote mutants with significant catalytic but not affinity effects. Colored and gray points denote statistically significant and insignificant effects, respectively, based on statistical tests (bootstrap hypothesis tests) comparing each mutant distribution to the WT PafA distribution. Left arrows denote upper limits for mutants with catalytic activities below the dynamic range of the assay, right arrows denote lower limits for mutants with MeP KM values below the lowest substrate concentration used, and vertical arrows denote upper and lower vanadate Ka limits (Materials and Methods). (E) PafA structure with spheres shown for residues with significantly deleterious catalytic and vanadate affinity effects when mutated to either glycine or valine (35 of 520 measurable residues). (F) PafA structure with spheres shown for residues with significant catalytic but not significant affinity effects (125 of 520 measurable residues). Catalytic data are from reference (50).

