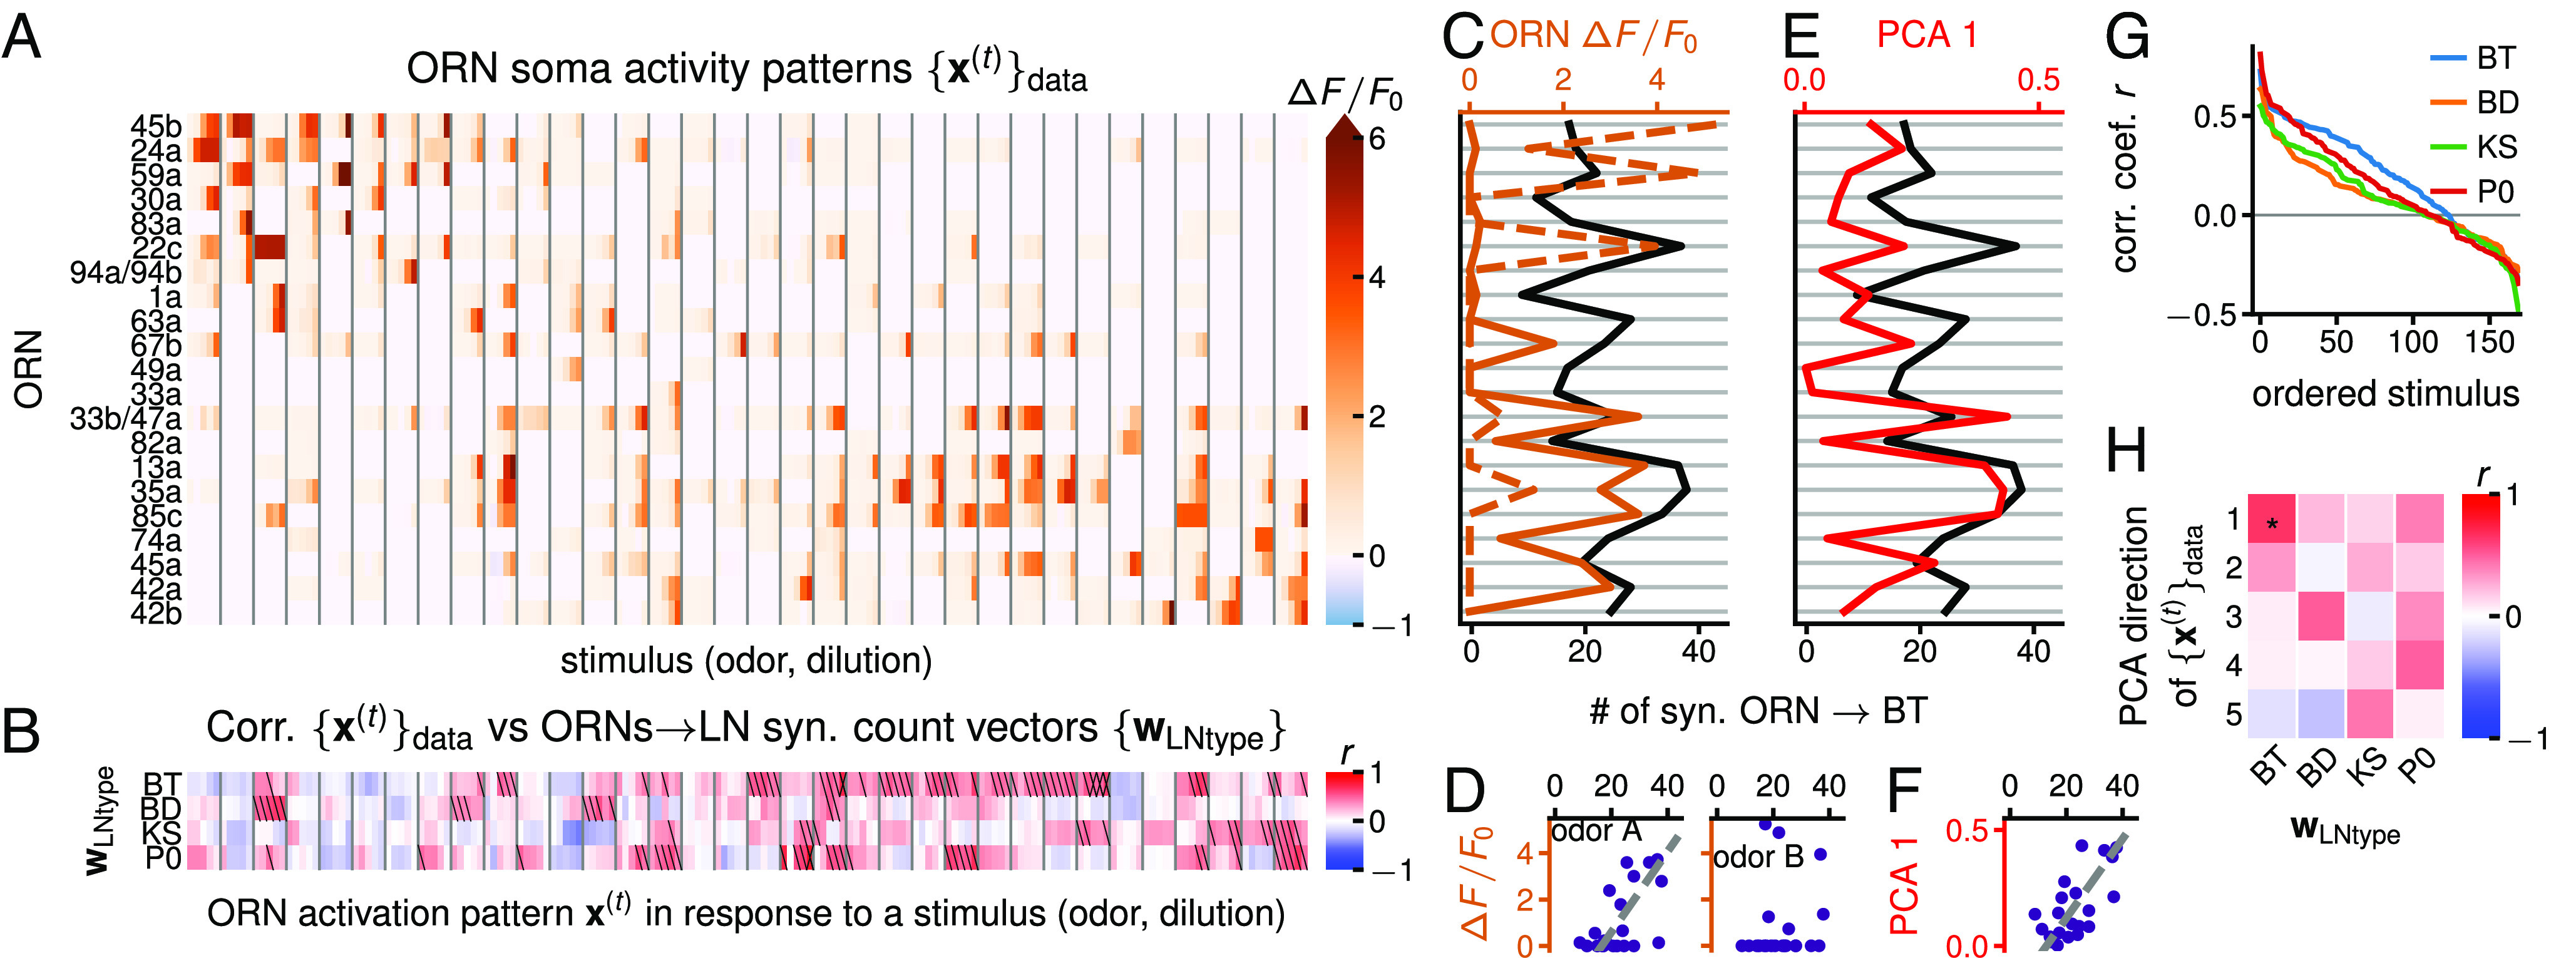
Fig. 2.

Alignment of ORNs LN synaptic count vectors with odor representations in ORN activity. (A) Ca2+ activity patterns in ORN somas in response to 34 odors (separated by vertical gray lines) at 5 dilutions () from ref. 5. See SI Appendix, Fig. S3 for odor labels and scaled . (B) Correlation between the four ORNs LN synaptic count vectors ( for BT, BD, KS, and P0) with the odor representations from (A). Slash: significant at 0.05 level; cross: significant at 0.05 FDR (false discovery rate) (31). P-values calculated by shuffling the entries of each (50,000 permutations). (SI Appendix, Figs. S4A and S5). (C) ORNs Broad Trio synaptic count vector superimposed with ORN activity patterns and in response to the ligands 2-heptanone (odor A) and 2-acetylpyridine (odor B) at dilution . y-axis: ORN, follows order of (A). (D) Scatter plot representation of (C). is more strongly tuned to (, ) than to (, ). P-values not adjusted for multiple comparisons. (E) superimposed on the 1st PCA direction of . -axis: ORN, follows order of (A). (F) Scatter plot representation of (E) (, ). P-values are not adjusted for multiple comparisons. (G) LN “connectivity tuning curves”: correlation coefficients sorted in decreasing order from (B) for each . (H) Correlation coefficient r between the top 5 PCA directions of and the four s (SI Appendix, Fig. S6 A, B, and E). Two-sided P-values calculated by shuffling the entries of each (50,000 permutations). *: significance at 0.05 FDR.
