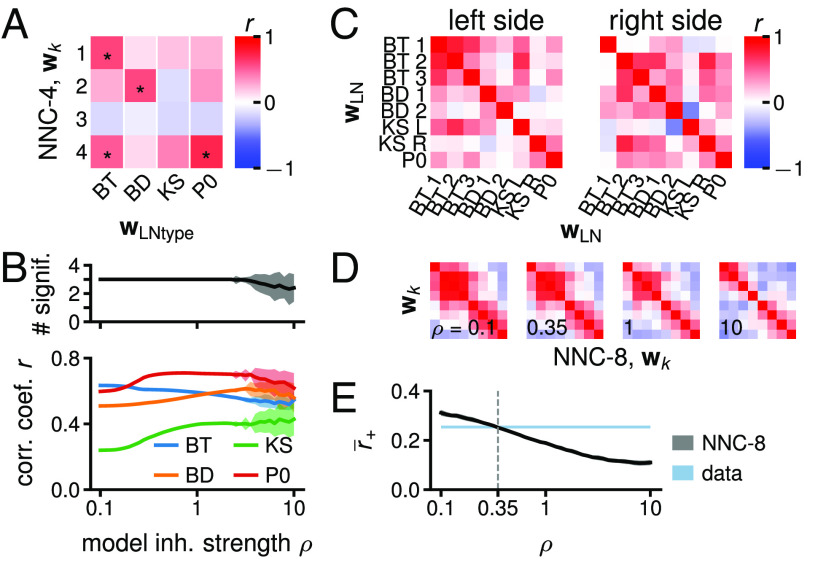
Fig. 3.
Prediction of the connectivity with the NNC and emergence of LN groups. (A) Correlation between the four ORNs LN connection weight vectors from NNC-4 () and the four ORNs LNtype synaptic count vectors (SI Appendix, Fig. S6 C, D, F, G, and H). One-sided P-values calculated by shuffling the entries of each (50,000 permutations). *: significant at 0.05 FDR. (B) Bottom: maximum correlation coefficient (mean SD) of the four s from NNC-4 with the four s for different values of (50 simulations per ), encoding the feedback inhibition strength. Top: number of s significantly correlated with at last one from NNC-4 (FDR at 5%). For , not all simulations converge to the same , , and , potentially due to existence of multiple global optima or simulations only finding local optima. (C) Correlation between the s on the left and right sides of the larva, portraying that several s are similar. (D) Same as (C) for the eight s arising from NNC-8 and with . Matrices ordered using hierarchical clustering and s ordered accordingly (SI Appendix). (E) Mean rectified correlation coefficient () from (C) (blue band delimited by the value for left and right circuit) and from NNC-8 (black line, mean SD, 50 simulations per ). obtained by averaging all the from a correlation matrix, i.e., (C) or (D), excluding the diagonal.

