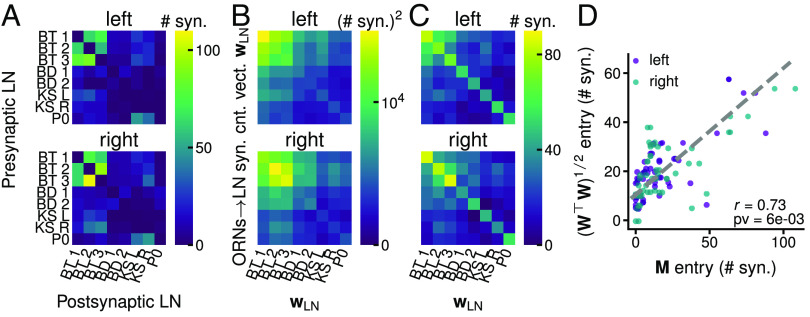
Fig. 4.
Relationship between LN–LN () and ORNs LN () synaptic counts in the connectome reconstruction. (A) LN–LN connections synaptic counts on the left and right sides of the larva. (B) with on the left and right sides. Thus each entry is , the scalar product between 2 ORNs LN synaptic count vectors . (C) , i.e., the square root of the matrices in (B). (D) Entries of vs entries of , excluding the diagonal, for both sides. r: Pearson correlation coefficient. pv: one-sided P-value calculated by shuffling the entries of each independently, which assures that each LN keeps the same total number of synapses. Shuffling the entries of in addition to shuffling each leads to P-value .

