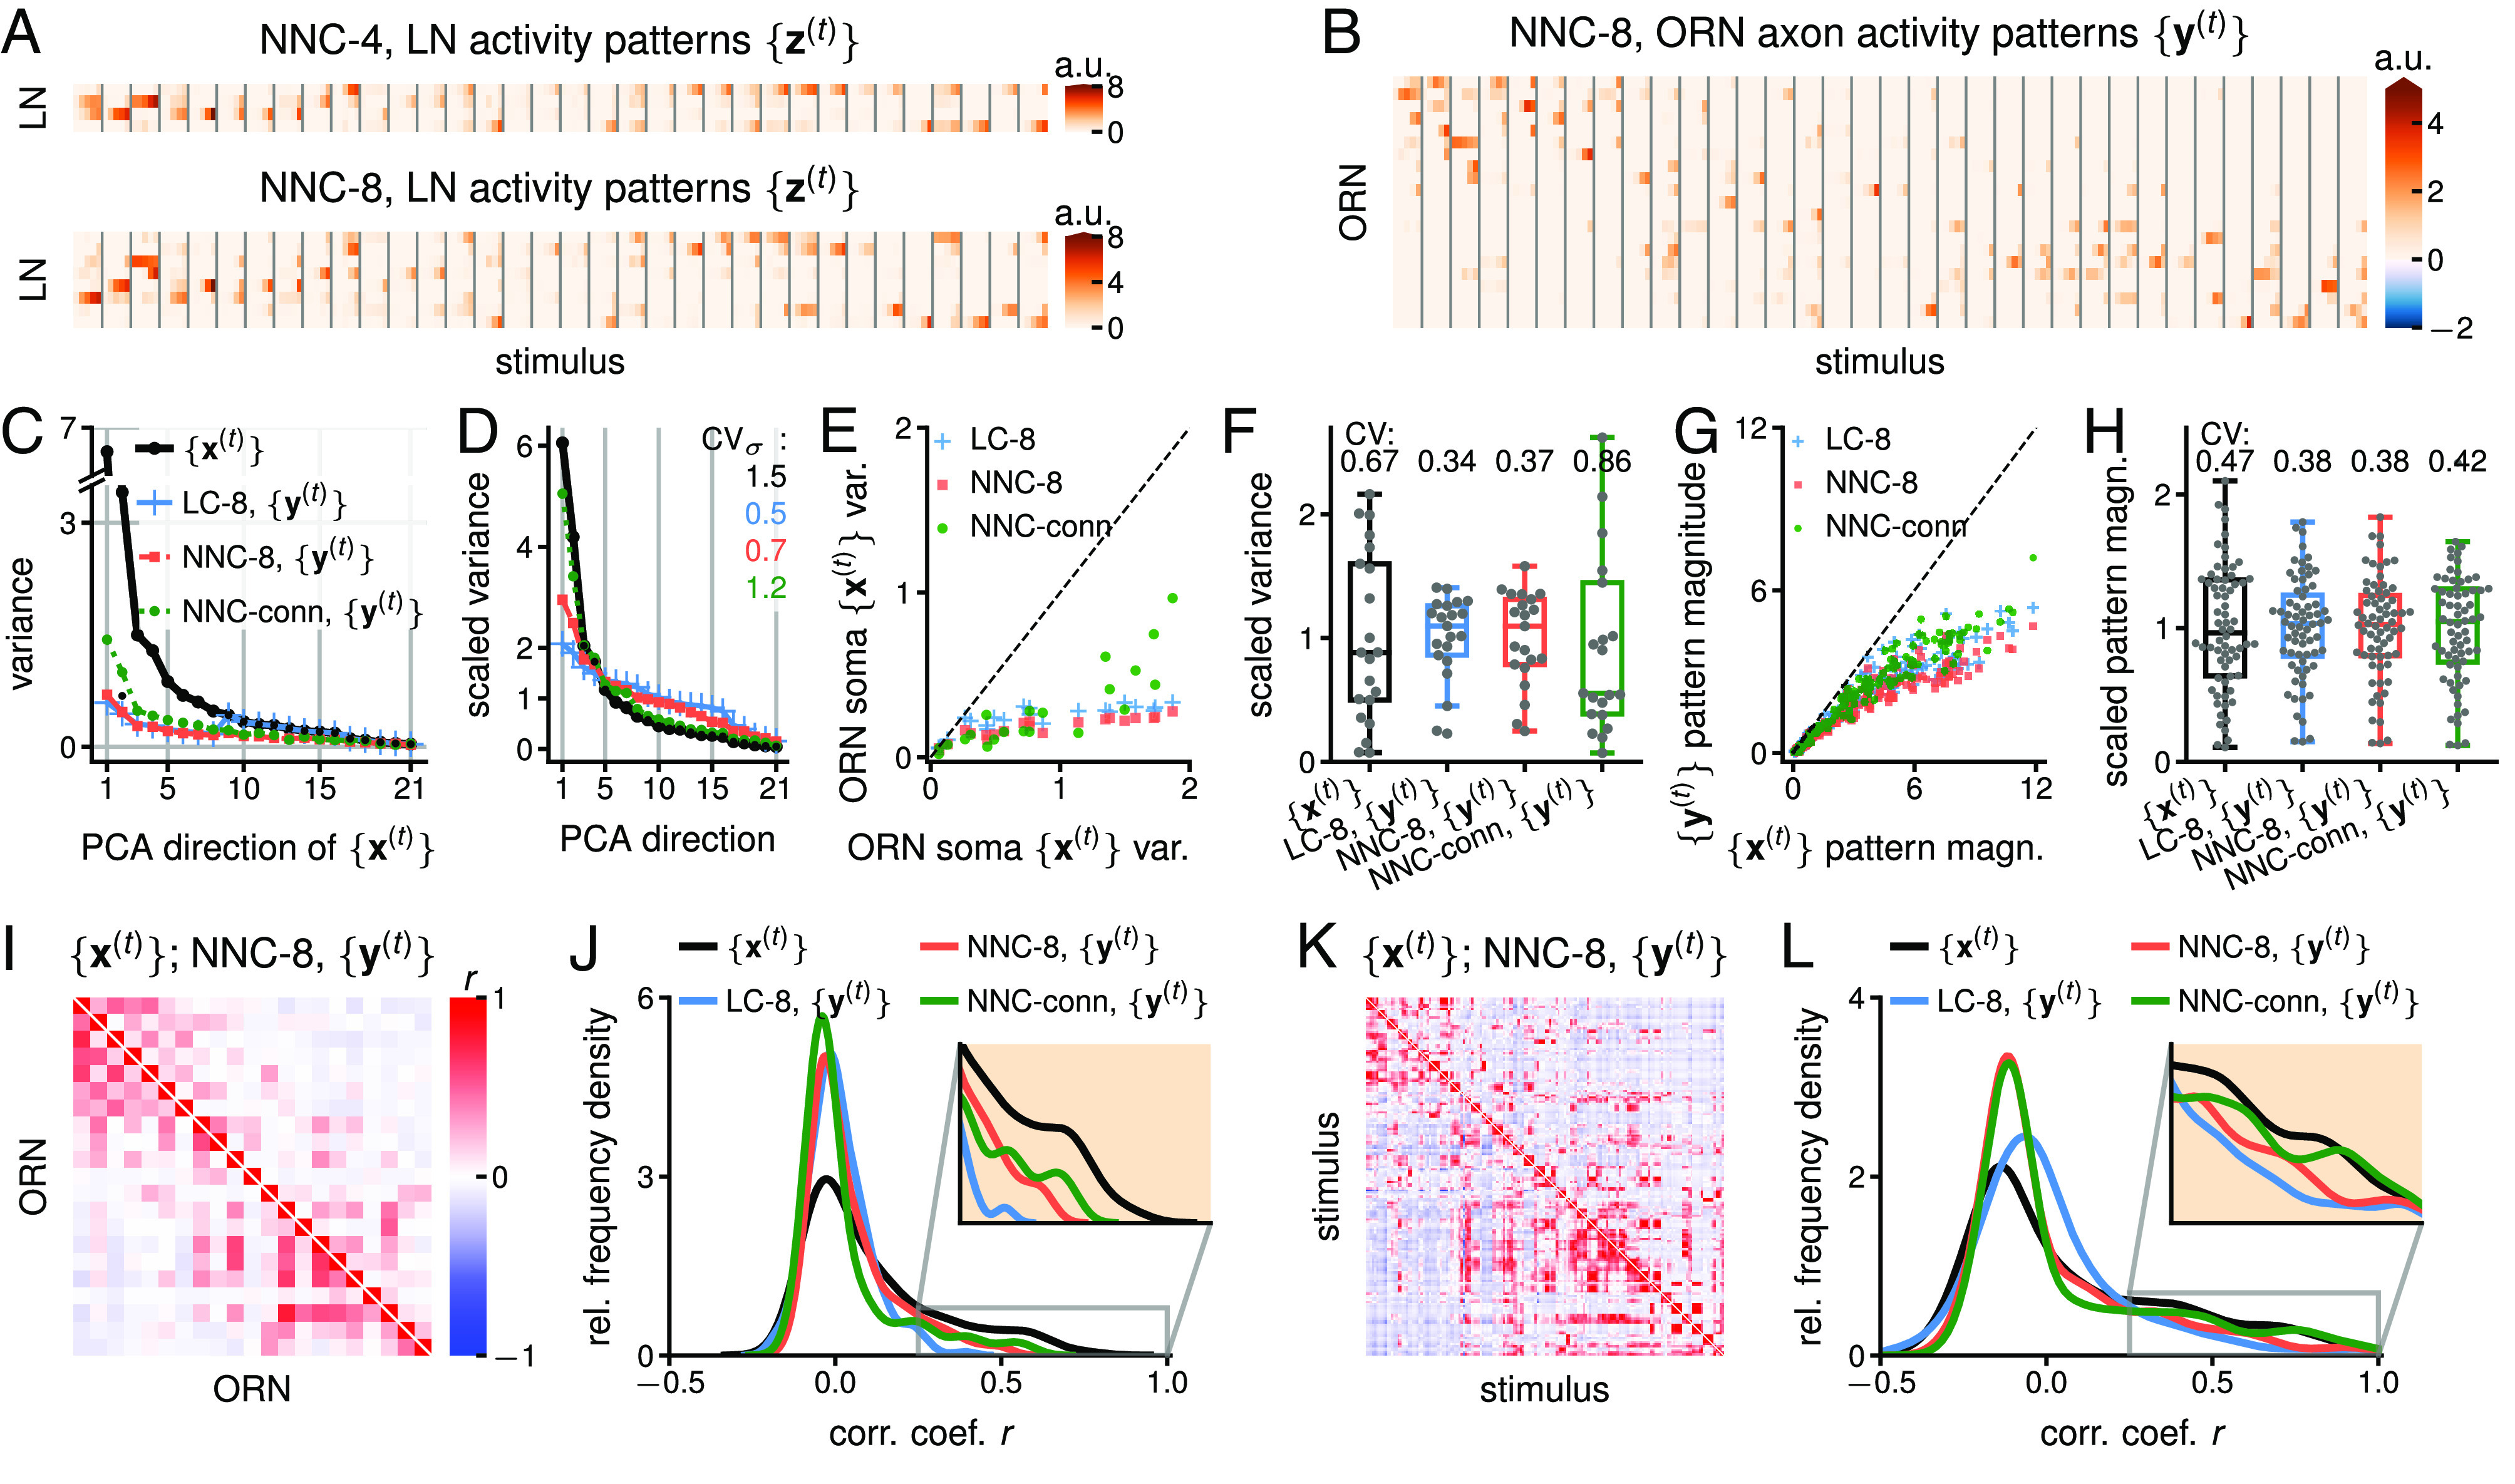
Fig. 6.

Computation in the LC, NNC, and NNC-conn models in response to (Fig. 2A): clustering, partial whitening, normalization, and decorrelation. (A) LN activity, , for the NNC-4 and NNC-8 models (SI Appendix, Fig. S11). LNs are mostly active in response to the odors to which their connectivity is the most aligned (SI Appendix, Fig. S8A). (B) ORN axon activity, , in the NNC-8. (C) Variances of odor representations in ORN somas () and axons () in the PCA directions of uncentered (). The variances decrease the strongest in the directions of the highest initial variance. (D) Uncentered PCA variances and scaled by their mean to portray the spread of variances. (E) Uncentered variances of activity at ORN axons (, output) vs. in ORN somas (, input). (F) Box plot of the ORN activity variances from (E) scaled by their mean to show the spread of variances. (G) Magnitude of the 170 activity patterns in ORN axons vs in somas . (H) Box plot of the activity pattern magnitudes from (G) (only for top two dilutions and ) scaled by their mean to show the spread of magnitudes. (I) Correlations between the activity of ORN somas (, Lower Left triangle) and of ORN axon activity in NNC-8 (, Upper Right triangle). (J) Smoothed histogram of the channel correlation coefficients from (J), excluding the diagonal (based on n=210 values). In all models, at the axonal level, there are more correlation coefficients around zero and fewer at higher values. (K) Correlations between activity patterns (i.e., odor representations) in ORN somas (, Lower Left triangle) and in ORN axons for NNC-8 (, Upper Right triangle). (L) Smoothed histogram of the activity pattern correlation coefficients from (K) (only for top two dilutions and , n 2,278). Similar effect as for channels in (J). The decorrelation in the LC is more effective than in the NNC. The decorrelation in NNC-conn is not as pronounced as for the other two models. in this figure. a.u.: arbitrary units, stands for appropriate unit of neural activity. See SI Appendix, Figs. S12–S16 for the alignment of PCA direction, the LC, the NNC, the NNC-conn, and .
