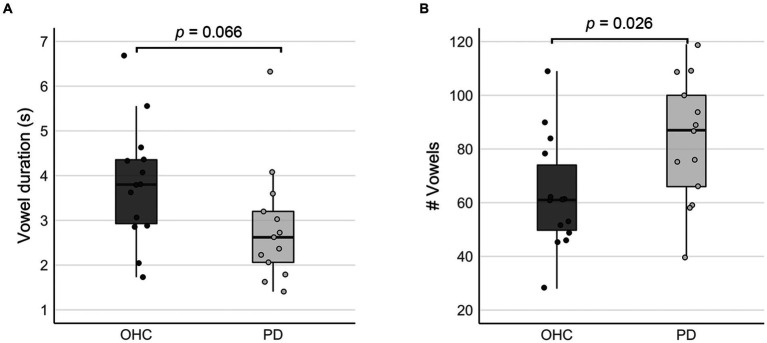
Figure 2.
Comparison of self-paced task performance between OHC and PD groups (inside the scanner). Box plots depict (A) mean vowel durations, and (B) the mean number of vowels produced when performing the sustained vowel task in the MRI scanner. Whisker lines reflect 1.5 times the interquartile range. Dots represent data points for individual participants.

