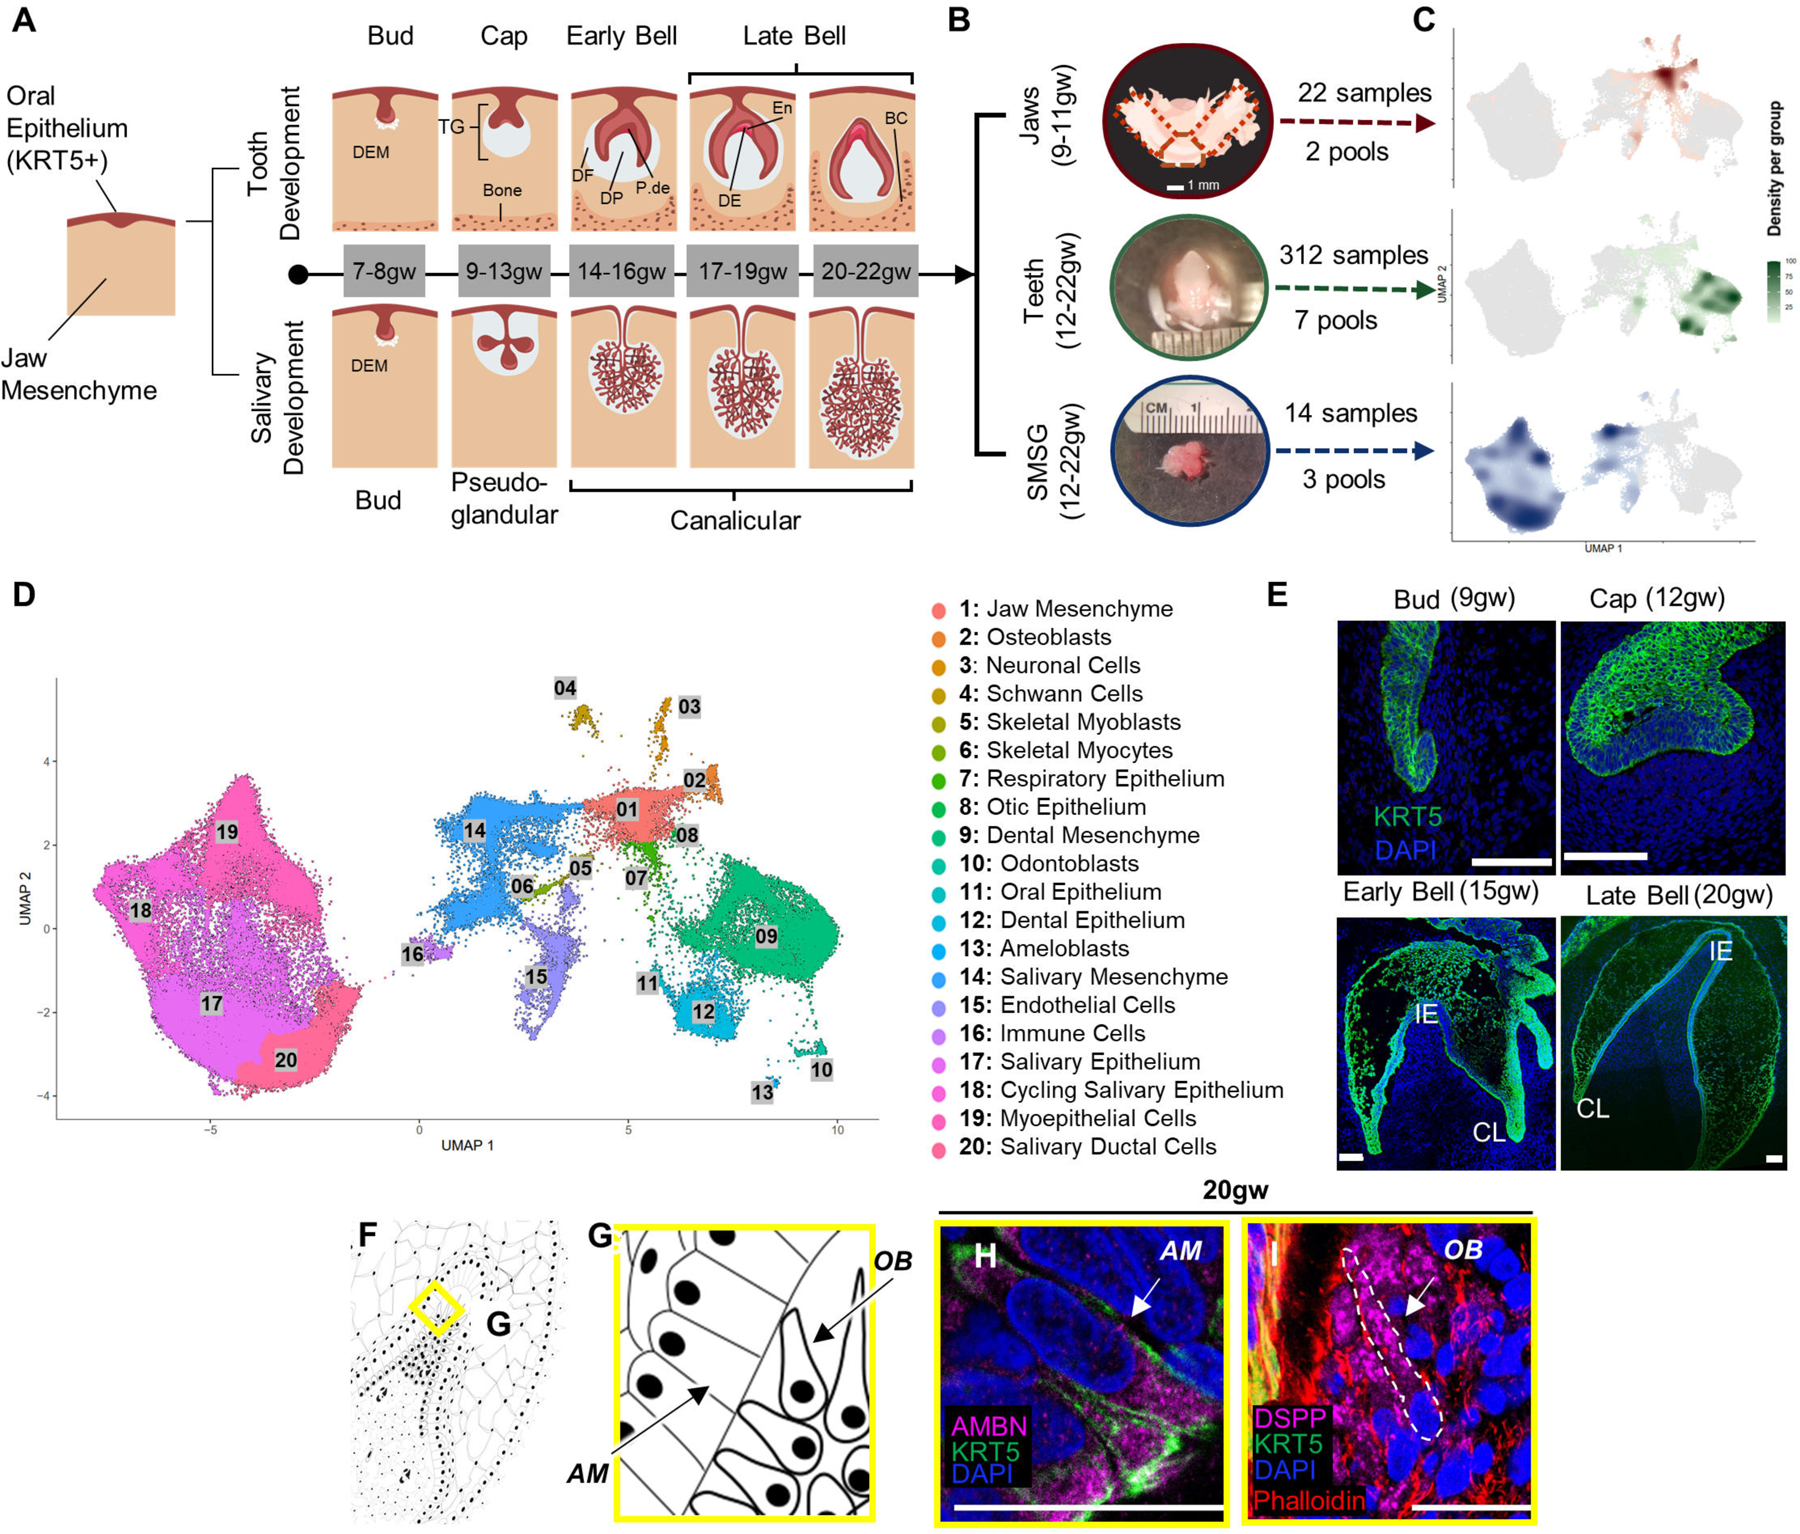
Figure 1. Single-cell census of developing human fetal jaws, teeth, and salivary glands using sci-RNA-seq.

(A) Stepwise development of oral epithelium (red) and dental ectomesenchyme (grey) leading to tooth and salivary gland formation. TG: toothgerm, DF: dental follicle, DP: dental papilla, P-de: pre-dentin, De: dentin, En: enamel matrix. (B) Dissection of toothgerms and salivary glands from fetal jaw tissue. (C) Density plots showing tissue types in UMAP coordinate. (D) UMAP graph with 20 annotated clusters. (E) Immunofluorescence staining of toothgerms with Krt5 (green) and nuclear stain DAPI (blue). Abbreviations: incisal edge (IE), cervical loop (CL). (F, G) Simplified illustration. Immunofluorescence of toothgerms with DSPP (odontoblast marker) and AMBN (ameloblast marker) at 20gw (H, I). Scale bars: 50μm.
