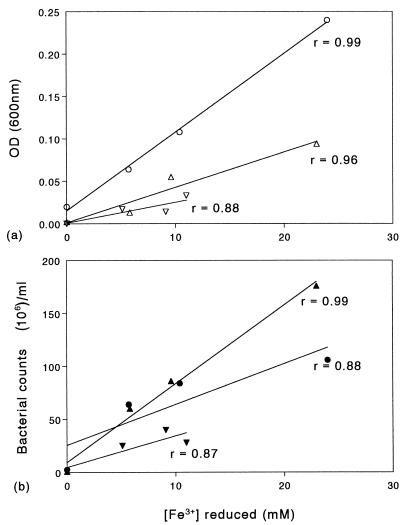
FIG. 4.
Relationship between ferric iron reduction and biomass yields, as determined by optical densities of resuspended bacteria (a) and counting of moderately thermophilic iron-oxidizing bacterial cells grown under anaerobic conditions (b). Symbols: ○ and •, S. acidophilus YTF1; ▿ and ▾, S. thermosulfidooxidans TH1; ▵ and ▴, A. ferrooxidans TH3. The linear correlation coefficients (r values) are shown. OD (600 nm), optical density at 600 nm.

