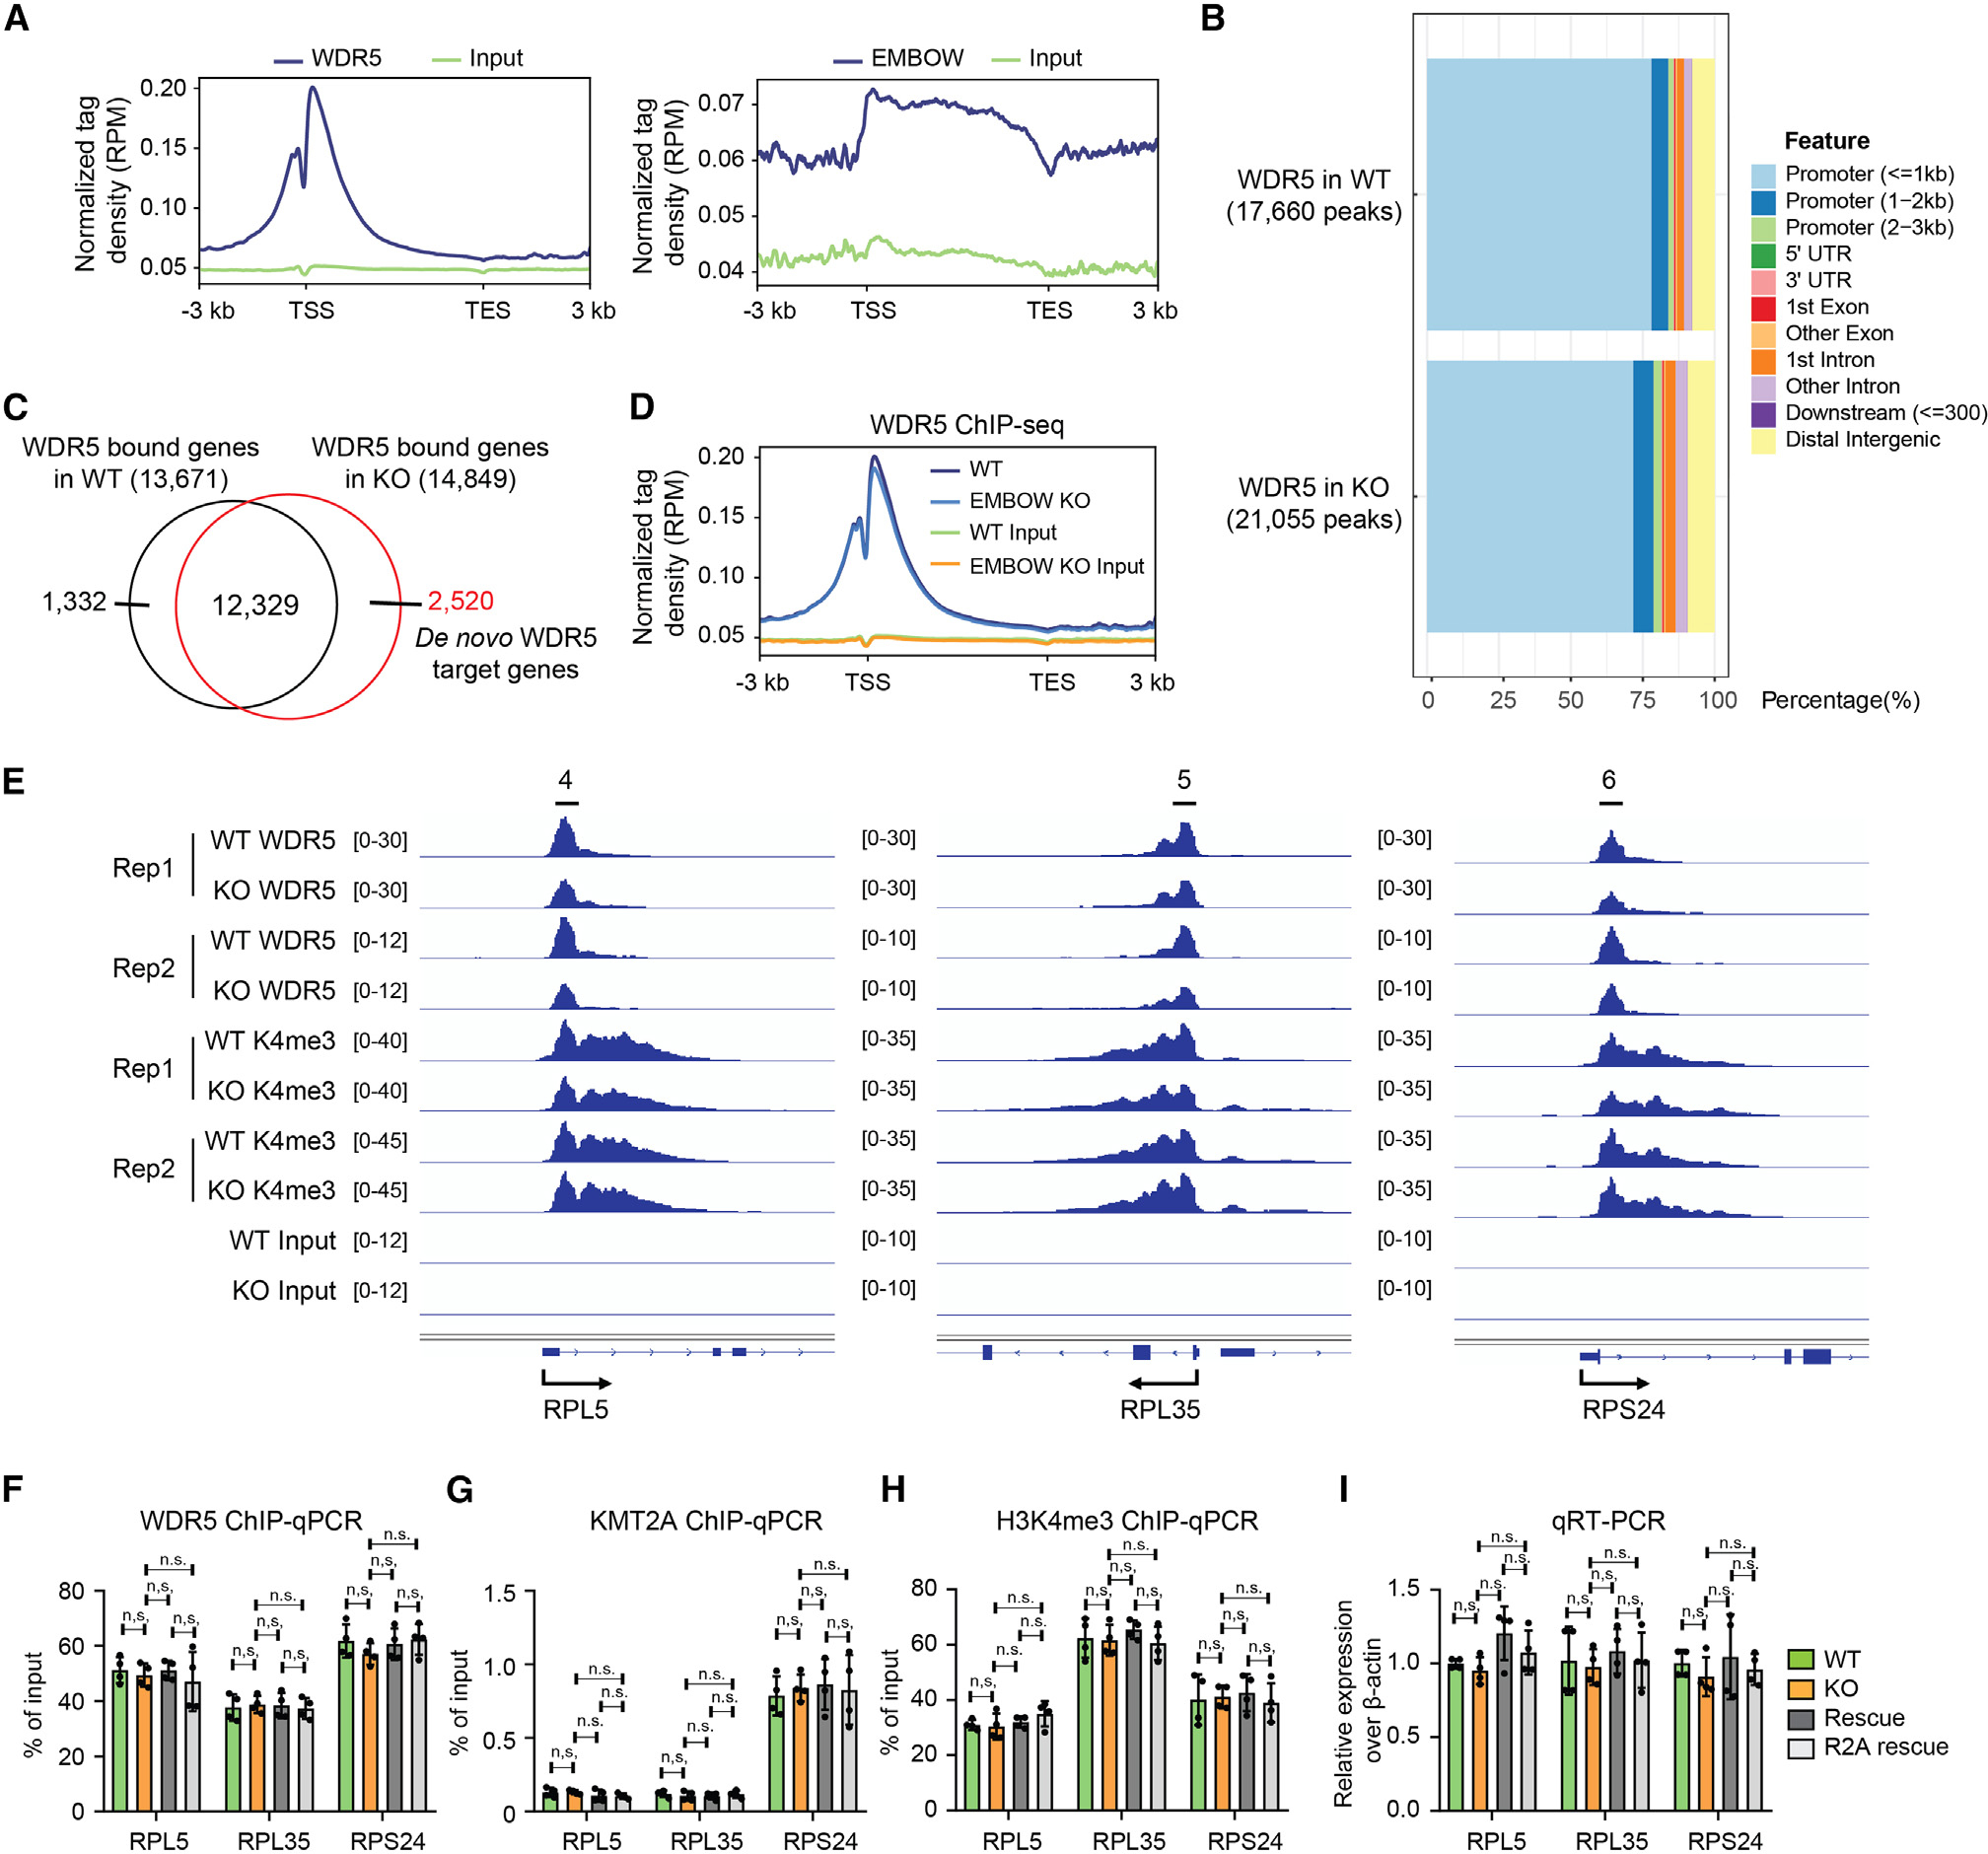
Figure 5. Loss of EMBOW does not change WDR5 or H3K4me3 levels at WDR5 on-target genes.

(A) Profile of WDR5 (left) and EMBOW (right) ChIP-seq signal at all UCSC (The University of California, Santa Cruz) annotated genes in HEK293T cells.
(B) The genomic distribution of WDR5 ChIP-seq peaks in wild-type (top) or EMBOW KO (bottom) cells.
(C) Venn diagram of WDR5-bound genes in WT or EMBOW KO cells. The WDR5-bound genes are defined as those genes with a WDR5 peak within ±1-kb distance of the gene’s transcription start site (TSS) with a 3-kb flanking distance.
(D) Profile of WDR5 binding on WDR5 on-target genes in WT and EMBOW KO cells.
(E–I) WDR5 binding and H3K4me3 levels at three WDR5 target ribosomal genes upon EMBOW KO, shown by ChIP-seq snapshots (E), and confirmed by ChIP-qPCR with an anti-WDR5 antibody (F), an anti-KMT2A antibody (G), or an anti-H3K4me3 antibody (H). Quantitative RT-PCR (qRT-PCR) results of the three ribosomal genes are shown in (I). Data represent mean values ± SEM; N = 4 biologically independent samples. Significance (p value) was evaluated with one-way ANOVA (Dunnett’s test).
n.s., not significant; Rep, replicate; RPM, reads per million reads.
