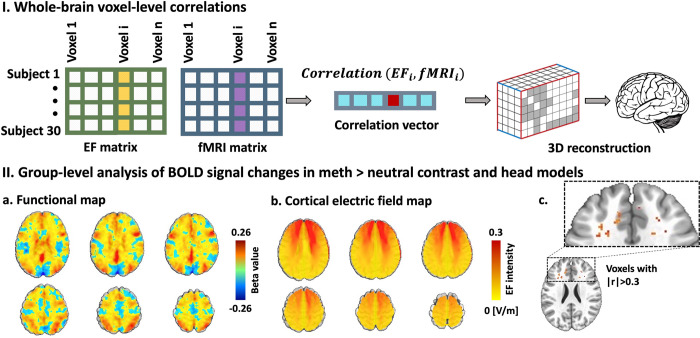
Fig 3. Voxel-level associations.
I. Whole-brain voxel-level correlation analysis pipeline. Dose-Response (EF-fMRI correlation) at the voxel-level in a whole-brain approach. a. Electric field (EF) maps were vectorized and arranged along the columns, with participants in the active group represented along the rows to construct the EF matrix. A similar approach was employed to generate an fMRI matrix for the meth > neutral contrast. The active group comprised 30 participants, and the total number of voxels analyzed was 96 x 114 x 96. The correlation vector captures the relationship between each corresponding voxel in the EF and fMRI matrices. II. Whole-brain voxel-level correlation analysis results. a. Group-level functional map. Changes in BOLD signal (Post–Pre) in the meth vs. neutral contrast at the group-level for participants in the active group. b. Group-level analysis of head models. EF distribution patterns observed in participants in the active group, with anode/cathode positioned over F4/Fp1. c. Correlation results. Prior to the false discovery rate (FDR) correction, some voxels showed |r|>0.3 and p uncorrected< 0.05. However, none of them survived FDR correction.

