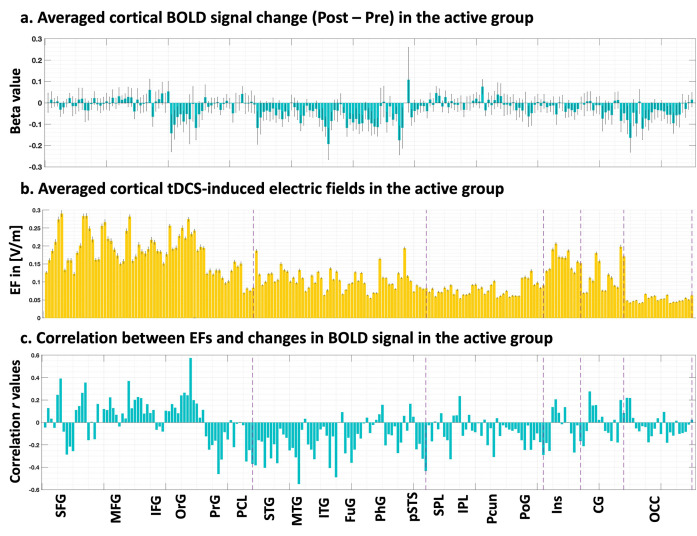
Fig 4. ROI-level associations.
a. Cortical BOLD signal change. Applying Brainnetome atlas parcellation to the first-level functional maps obtained from general linear models (Post minus pre-stimulation and meth vs. neutral contrast) for the active group. b. Individualized computational head models. Head models were parcellated using the Brainnetome atlas. Averaged electric fields (EFs) were calculated only in cortical subregions. c. Correlation r values. Pearson correlation coefficients between all pairs of ROIs (EFs and BOLD signal change) were calculated in the active group and none of them survived FDR correction. Bars show mean value and error bars show standard errors.

