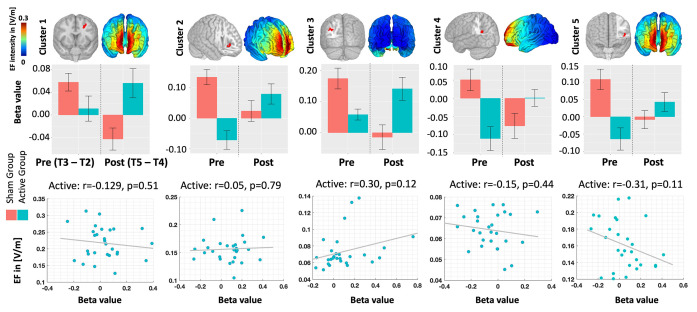
Fig 5. Cluster-level associations.
Top row: Clusters exhibiting significant time-by-group interactions in the second-level analysis of individualized fMRI maps. Group-level computational head models are also depicted in the corresponding view. Middle row: BOLD signal within the identified significant clusters, represented separately for each group in Pre- and Post-stimulation conditions. Bottom row: Correlation between BOLD signal and EFs within the clusters. Notably, no significant correlation was observed at the cluster level. However, the regression analysis revealed a significant effect for the group. Bars show mean value and error bars show standard deviations.

