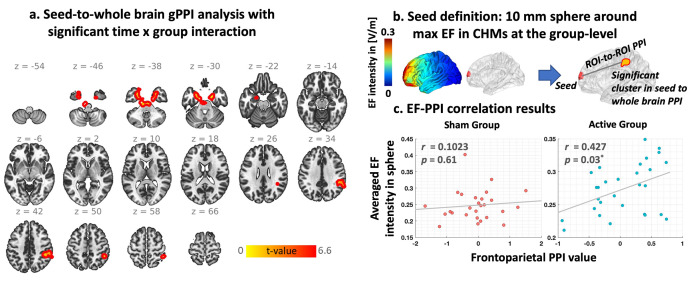
Fig 6. Dose-Response (EF-fMRI correlation) at the Network-level integration based on seed-to-whole brain generalized psychophysiological interaction (gPPI).
a. Brain regions with significant time by group interaction in gPPI analysis (two significant clusters in bilateral amygdala and hippocamp, and right inferior parietal lobule (IPL)). b. defining seed region based on a 10 mm sphere around the 99th percentile of the electric field (EF) location. c. correlation between averaged EF intensity within the 10 mm sphere and PPI connectivity between the sphere around the 99th percentile of the EFs and IPL cluster in each group separately (active: r = 0.42, P corrected = 0.03, sham: r = 0.10, p corrected = 0.61).

