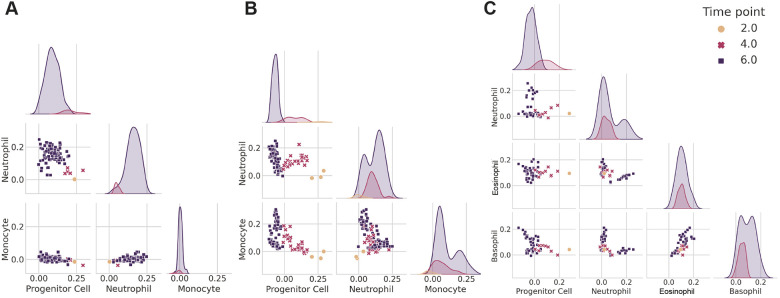
Fig. 6.
Visualizing hematopoietic lineage tracing with scTOP. (A-C) Scatter plots and distributions of scTOP scores for individual in vitro clone families from Weinreb et al. (2020). The scatter plots show the x-axis scTOP score compared with the y-axis scTOP score for individual cells, and the distributions show the scTOP scores of the type indicated on the x-axis of the corresponding column. The color and shape of each marker (and the color of each distribution) indicate the days in culture on which the cells were extracted. (A) A clone family in which all of the cells end up becoming neutrophils. (B) A clone family in which some clones end up becoming neutrophils and some become monocytes. At day 2, the three sister cells have low neutrophil and monocyte scores and high progenitor scores. At days 4 and 6, the progenitor scores decrease, and a portion of the cells increase in monocyte scores whereas others increase in neutrophil scores. (C) A clone family in which the descendant cells become neutrophils, eosinophils and basophils.

