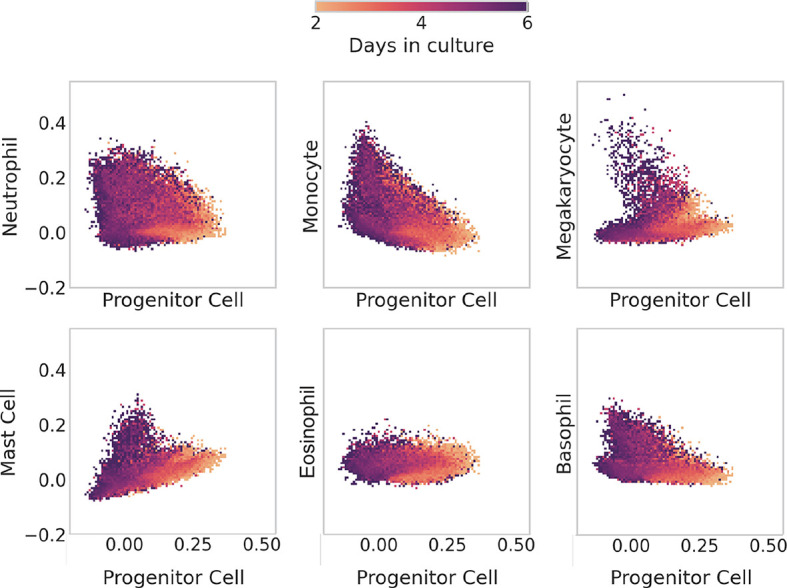
Fig. 7.

Tracing differentiation of hematopoietic cells from progenitor to mature types. Two-dimensional histograms of all of the in vitro clone families from Weinreb et al. (2020), with the x-axis of each one indicating the scTOP score for hematopoietic progenitor type and the y-axis showing the score for a mature type. Each bin of the histogram is colored by the average day in culture of the data points that fall within the bin. Early cells have high progenitor scores and low mature-type scores. As time passes, cells end up with high scores in mature types.
