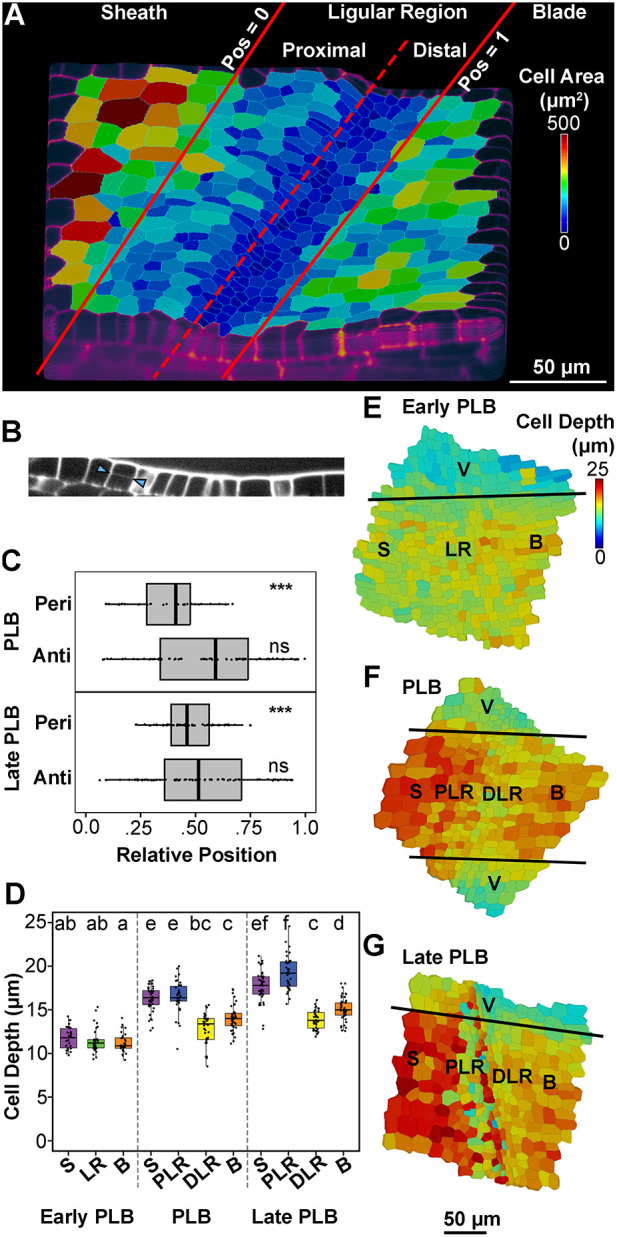
Fig. 4.

Differential cell thickening and periclinal divisions contribute to formation of the preligule ridge. (A) MorphoGraphX projection outlining the zones of the ligular region. Position 0 is the proximal extremity of the ligular region and position 1 is the distal extremity. (B) An orthoslice highlighting a periclinal division in the proximal ligular region (arrowheads). (C) Relative position of periclinal divisions within the ligular region was determined from confocal micrographs of plants expressing either CFP-Tubulin or TAN-YFP. ***P<0.01 (one-sample chi-squared tests for variance). ns, not significant (P>0.05). (D) Cell depth was measured from confocal z-stacks at anticlinal faces of cells that had not yet undergone periclinal divisions, in the ligular region of the maize leaf adaxial epidermis (n=3 leaves per stage, 10-15 cells per region per leaf). Significance was determined via Kruskal–Wallis test with Dunn's post-hoc, adjusting P-values via the Benjamini-Hochberg method for multiple comparisons, at an alpha of 0.05. Letter rankings indicate comparisons between all stages and epidermal zones: lowercase letters are used to label means, such that bars bearing different letters are statistically different from one another with a minimum P-value of <0.05. Box plots show the first to third quartiles as boxes, with the center line indicating the median. The rest of the range, excluding outliers, is indicated by the whisker lines. All data points, including outliers, are shown as dots. (E-G) 3D MorphoGraphX heatmaps of cell depth during early ligule development. The original scans for E and G are the same as those used for the corresponding stage in Fig. 3. B, blade; DLR, distal ligular region; LR, ligular region; PLR, proximal ligular region; S, sheath; V, vasculature.
